Category: Science

  • [Science] AI Mostly Avoids Unnecessary Medical Tests — But Stumbles Where Doctors Disagree

    [Science] AI Mostly Avoids Unnecessary Medical Tests — But Stumbles Where Doctors Disagree

    Ask a popular AI chatbot whether you need a thyroid ultrasound for a small nodule your doctor found by accident, and there is a real chance it will tell you to get one anyway — even though medical guidelines say not to bother. A large new benchmark study finds that commercial AI models mostly avoid recommending unnecessary medical tests and treatments when restraint is the right call. But in the small slice of cases where human doctors themselves disagree about what counts as “necessary,” the AI stumbles right alongside them.

    原論文情報 / Original Paper
    Title: Overuse and False Restraint in Large Language Model Recommendations for Choosing Wisely Scenarios
    Authors: Dean Ariel, MD, MPH, et al.
    Journal: Annals of Internal Medicine
    DOI: 10.7326/ANNALS-26-01667

    What the Study Actually Tested

    The research team, led by Dean Ariel, MD, MPH, of Clalit Health Services and Ben-Gurion University of the Negev in Israel, built 225 clinical scenarios from 15 recommendations issued by Choosing Wisely, a long-running U.S. campaign that lists tests and treatments doctors and patients should question because they rarely help and sometimes cause harm. Each scenario described a specific patient situation, such as a healthy adult requesting a routine heart scan or a patient with an incidentally discovered small thyroid nodule.

    For each of the 15 recommendations, the researchers wrote 10 scenarios in which the right move was restraint (skipping the test or treatment) and 5 scenarios in which action was actually warranted. They then put all 225 scenarios to six commercial large language models, with each model answering every scenario three times, for 4,050 responses in total — 2,700 on the restraint scenarios and 1,350 on the action scenarios. That split matters: the 150 restraint scenarios (times six models and three runs) are where “unnecessary care” can be measured, while the 75 action scenarios are where “wrongly withholding care” can be measured. The two error rates below come from those two different slices, not from one shared pool of 4,050 responses.

    Choosing Wisely has been running since 2012, built around a simple idea: ask medical specialty societies themselves to name the tests and treatments their own members order too often. The campaign’s lists now cover hundreds of recommendations, from skipping antibiotics for a simple cold to avoiding imaging for uncomplicated lower-back pain. Using it as the study’s yardstick means the “right answer” for each scenario was not the researchers’ own judgment call — it came from the specialists most familiar with each procedure’s actual value.

    Low Overuse, With Exceptions

    Across the scenarios where restraint was the right call, the AI models recommended potentially unnecessary care in just 5.4% of responses. For eight of the fifteen Choosing Wisely recommendations tested, the models never once suggested the unnecessary test or treatment — a result that held steady across scenarios involving imaging, lab work, and routine screening alike.

    In scenarios where restraint was the right answer, AI chatbots still recommended unnecessary care 5.4% of the time overall — but that average hid a couple of scenarios where they got it wrong nearly half the time.

    On the other side of the ledger, the models were also cautious about swinging too far toward withholding care altogether. In the scenarios where testing or treatment was actually warranted, they failed to recommend it — a pattern the researchers call “false restraint” — in only 0.6% of responses. In other words, the dominant failure mode by far was ordering too much, not too little, but neither failure was common.

    Where the AI Models Stumbled

    The 5.4% average mask two restraint scenarios where the models struggled far more than usual. The worst was thyroid ultrasound imaging for a small, incidentally discovered nodule with no worrying features: the AI models recommended the unnecessary scan in 42.8% of their responses to that scenario. The second-worst was routine electrocardiogram (ECG) screening for low-risk adults with no symptoms, where models recommended the unneeded test in 28.3% of their responses.

    On the false-restraint side, the single riskiest category was prostate-specific antigen (PSA) testing, where the models wrongly withheld a test that was actually appropriate in 3.3% of their responses to that scenario — still low, but the highest rate among the categories studied.
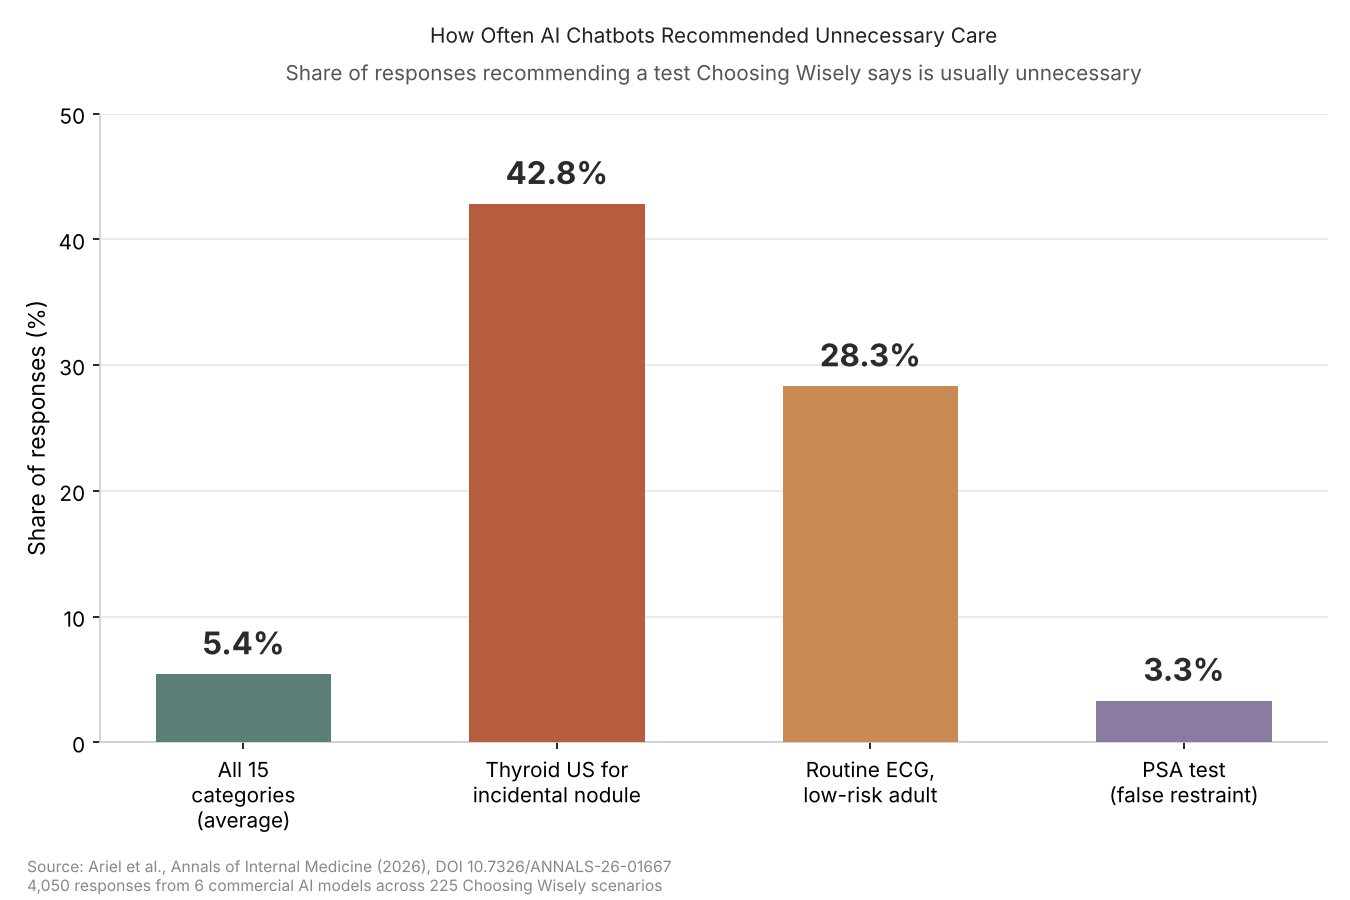
    Chart showing AI chatbots recommended unnecessary care in 5.4% of responses overall, 42.8% for thyroid ultrasound, 28.3% for routine ECG, and 3.3% false restraint for PSA testing
    Source: Data from Ariel et al., Annals of Internal Medicine (2026)

    Why Doctors Themselves Can’t Agree

    The authors point to a possible explanation that has nothing to do with AI being broken: on thyroid nodules specifically, medical societies themselves do not agree. Different professional guidelines draw the line for “worth scanning” at different nodule sizes and risk profiles, and primary care doctors in the real world follow that same disputed judgment call in different directions. One plausible reading is that large language models, trained heavily on published medical literature and real clinical text, picked up on that same disagreement — though the study itself does not prove which training material caused the errors, only that the errors cluster exactly where human guidance is split.

    That is a notably different story from an AI simply failing to learn the rules. It suggests these models are not making random errors; their mistakes line up with the same contested judgment calls that divide human doctors.

    What This Means for Patients and Doctors

    An editorial published alongside the study, written by Dr. Deborah Korenstein of the Icahn School of Medicine at Mount Sinai and Dr. Daniel Morgan of the VA Maryland Health Care System and University of Maryland, cautions against reading too much into a benchmark built from hypothetical scenarios. Real clinical decisions involve a patient’s full history, a physical exam, and a conversation — not a paragraph of text handed to a chatbot. The editorial argues that any claim about AI’s real clinical value needs to be tested with actual patient encounters, not written vignettes.

    Even so, the stakes are real and rising. Patients increasingly ask AI chatbots for a second opinion before or after seeing a doctor, and some clinicians already lean on AI tools to help triage test requests. If an AI model inherits a human blind spot rather than correcting for it, it can quietly reinforce the same overtesting it was supposed to help reduce — particularly in exactly the gray-area cases where patients most need a clear, confident answer. That risk echoes a broader pattern researchers have flagged elsewhere: a Berkeley study found that leaning on AI for help can quietly erode a person’s own persistence and judgment over time, which is worth keeping in mind any time a difficult, ambiguous decision gets outsourced to a chatbot by default.

    The study did not measure real-world costs, but the shape of the risk is easy to see: if similar errors occur often enough in actual chatbot use, they could add up to unnecessary follow-up scans, biopsies, and patient anxiety over findings that were never going to matter. That remains a hypothesis, not something this benchmark demonstrated.

    The Limits of a Multiple-Choice Test

    Choosing Wisely scenarios are, by design, close to a clean multiple-choice test: a well-defined clinical situation with an established “right” answer from a respected guideline body. Most real medical decisions are messier, shaped by a patient’s anxiety, family history, insurance coverage, and a dozen details a short text prompt cannot capture. The study’s own authors frame their 5.4% overuse rate as reassuring but incomplete — strong evidence that today’s leading AI models have absorbed the broad principle of “don’t test without a reason,” paired with a reminder that they still default to the crowd’s judgment, flaws included, in the cases where the crowd itself is unsure.

    For now, the practical takeaway is less about whether AI chatbots are generally “safe” for medical questions and more about where their blind spots sit. In this benchmark, the models rarely withheld care that was genuinely needed, but unnecessary testing remained a real problem in a handful of gray-area scenarios. Because the study used hypothetical vignettes rather than real patients, more research is needed before anyone can say how these patterns play out in an actual exam room — which is exactly why a chatbot’s answer on a borderline test is worth raising with an actual doctor rather than treating as a final word.

    Sources: American College of Physicians / Newswise press release, AuntMinnie, Annals of Internal Medicine (DOI)

  • A Green Hydrogen Catalyst Lasts Longest at the Freezing Point — RIKEN Finds

    A Green Hydrogen Catalyst Lasts Longest at the Freezing Point — RIKEN Finds

    Cool a chemical reaction down, and it should slow to a crawl — that’s basic chemistry. But for one hydrogen-making catalyst, the story turns out to be more complicated than that. Researchers at Japan’s RIKEN institute have found that a manganese oxide catalyst used to split water into hydrogen degrades the least right around the freezing point of water, and then degrades faster again once the water is chilled further still. The finding offers a new angle on one of green hydrogen’s stubborn cost problems: catalysts that wear out too fast.

    原論文情報 / Original Paper
    Title: Cooling Water to Near Freezing Breaks the Activity-stability Trade-off of Water Oxidation Electrocatalysis
    Authors: Wardhana, A. C. et al.
    Journal: Nature Chemistry
    DOI: 10.1038/s41557-026-02274-8

    The Weak Link in Green Hydrogen

    Splitting water into hydrogen and oxygen using electricity from solar or wind power is the core process behind “green hydrogen,” a carbon-free alternative to fossil fuels for power generation, steelmaking, and transport fuel. Hydrogen produced this way could, in principle, replace fossil fuels across a wide swath of heavy industry, which is why so much research funding is chasing it.

    The catch is cost. At the electrode where oxygen is released, the chemical environment is harshly oxidizing, and over time the catalyst coating that electrode slowly dissolves away. Replacing or maintaining it is a recurring expense, and durability problems like this are a big part of why electrolysis-based hydrogen still costs more than hydrogen made from natural gas. Any discovery that makes catalysts last longer without a complete materials overhaul is worth a closer look.

    Speed Versus Durability: The Old Rule

    Chemical reactions generally speed up as temperature rises — a basic rule of chemistry known as the Arrhenius relationship, named after the 19th-century chemist who first described it. Raise the temperature and a water-splitting reaction goes faster, which sounds like a straightforward way to boost hydrogen output. But raise the temperature too much, and the catalyst itself degrades faster too, since the harsh oxidizing side-reactions that eat away at it also speed up with heat. Cool things down, on the other hand, and the catalyst tends to last longer — but the water-splitting reaction itself slows to match. Engineers have generally treated this as a fixed trade-off: push for speed, and durability suffers; push for durability, and speed suffers.

    A Sweet Spot Right at Freezing

    A team led by Ryuhei Nakamura, team director at RIKEN’s Center for Sustainable Resource Science and a professor at the Earth-Life Science Institute at the Institute of Science Tokyo, decided to test that assumption directly. Using a manganese oxide (MnO2) catalyst, a common and inexpensive choice for this kind of reaction, the team ran the electrolysis across a wide temperature range — from a warm 80°C down to -12°C, well below the normal freezing point — and carefully tracked two things at once: how fast oxygen bubbled off the electrode, and how much manganese leached out of the catalyst as it broke down.

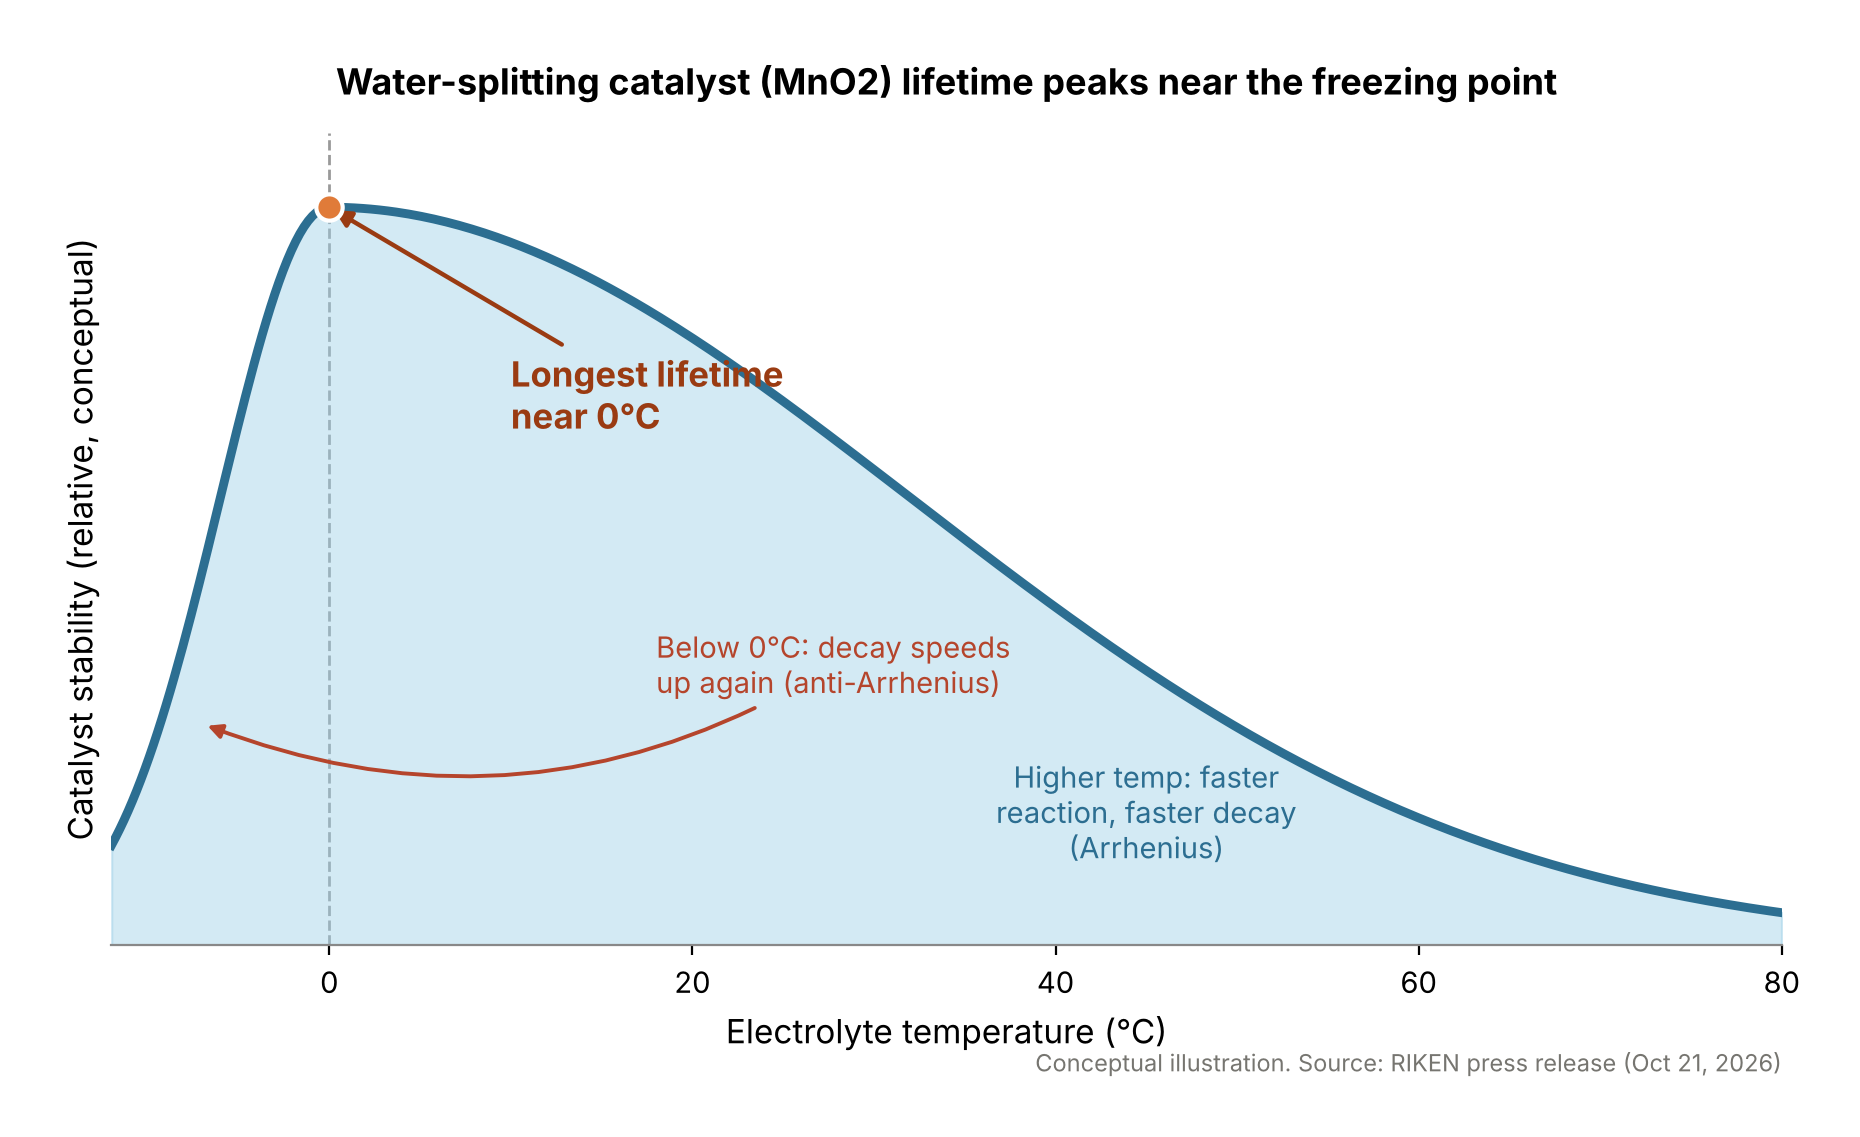
    The results were not what a simple reading of the Arrhenius relationship would predict. As the temperature dropped from 80°C toward 0°C, both the reaction rate and the degradation rate slowed down, as expected. But the degradation rate fell off by far more than the reaction rate did. In practical terms, that means that near 0°C, the catalyst could last substantially longer while giving up comparatively little reaction speed — a sweet spot hiding in plain sight. The team confirmed this wasn’t just a snapshot measurement: in longer-duration tests that ran a steady electric current through the cell and tracked how long the catalyst held up, lifespan peaked right around 0°C and then declined again as the electrolyte was chilled further, tracing out a distinct peak rather than a straight line.

    Why Colder Water Breaks It Faster

    The more surprising twist showed up below 0°C. Instead of continuing to degrade more slowly as temperatures kept dropping — which is what ordinary chemistry would predict — the catalyst flipped and started breaking down faster the colder it got. Chemists call this an “anti-Arrhenius” pattern, because it runs exactly opposite to the usual temperature rule. The effect was visible to the naked eye: an electrolyte solution held at -8°C turned noticeably deeper pink than one held at 2°C, a color change consistent with a buildup of permanganate ions, a telltale marker of the catalyst breaking down.

    Below 0°C, the colder the water got, the faster the catalyst broke down — the exact opposite of what ordinary chemistry would predict.

    The explanation traces back to a strange property of water itself, known as “supercooling.” Below 0°C, the sulfuric-acid electrolyte solution in the experiment didn’t freeze immediately — it stayed liquid in an unstable, supercooled state, confirmed in the study by triggering ice formation with mechanical shock and watching how the liquid behaved beforehand. Using Raman spectroscopy to examine the molecular structure of the water, the researchers found that the network of hydrogen bonds connecting water molecules in this supercooled state looks markedly different from the structure of ordinary water above 0°C. The team’s working hypothesis is that this altered molecular structure is what accelerates manganese loss from the catalyst, driving the faster breakdown seen at sub-zero temperatures.

    Catalyst durability has traditionally been tackled by redesigning the material itself — changing its chemical composition or its microscopic structure to make it more resistant to the oxidizing environment. A sulfur-based material that produces hydrogen from sunlight, developed elsewhere, is one recent example of that materials-first approach to cheaper hydrogen production. What stands out about this study is that it doesn’t touch the catalyst material at all. Instead, it shows that something as simple as tuning the temperature of the reaction environment can shift the balance between how active a catalyst is and how long it survives.

    Conceptual diagram showing catalyst stability peaking near 0C electrolyte temperature
    Based on the description in RIKEN’s press release (Oct 21, 2026)

    From Cold Climates to Icy Worlds

    The researchers see temperature as a new design lever that engineers could use alongside, or even instead of, changes to catalyst chemistry, to balance activity against stability. That has implications that go beyond ordinary industrial electrolyzers. The same principle could inform the design of electrochemical systems built to operate in cold or polar climates, where keeping equipment near room temperature is itself an energy cost. More speculatively, the findings could also help explain electrochemical reactions involving low-temperature water on other planetary bodies, where near-freezing or supercooled water may be common. The research team frames the work as contributing to UN Sustainable Development Goals centered on clean water and clean, affordable energy. The results were published October 21, 2026, in the journal Nature Chemistry, with support from Japan’s GteX program, JSPS KAKENHI, and other funding bodies.

    Not Just the Material, But the Setting

    A catalyst’s performance isn’t dictated by its composition and structure alone — that’s the central insight of this study. Something as simple as the temperature of the surrounding water can shift the balance between how fast a reaction runs and how long the catalyst that drives it survives. This result won’t make green hydrogen cheaper overnight, and plenty of engineering work stands between a laboratory finding and a commercial electrolyzer. But the idea of designing catalysts around the conditions they operate in, rather than focusing solely on the materials they’re made from, gives engineers a new variable to work with — one that costs nothing to install, since it only requires controlling a temperature that already has to be managed anyway.

    Sources: RIKEN press release, “Electrolysis catalyst becomes longer-lived near 0°C”, Nature Chemistry (DOI: 10.1038/s41557-026-02274-8)

  • [Science] Menopause Hits Like a Cliff, Not a Slope — 1-Million-Woman Study Finds

    [Science] Menopause Hits Like a Cliff, Not a Slope — 1-Million-Woman Study Finds

    A sweeping analysis of more than 300 million lab tests from over a million women suggests that menopause does not creep up gradually — it strikes as an abrupt, body-wide “physiological cliff,” with dozens of health markers shifting sharply around the final period. For women navigating this transition, the findings offer something rare: a population-level map of when bodies tend to change most, and new evidence that hormone therapy may soften some of the sharpest shifts in bone and liver markers.

    To be clear about what “cliff” means here: it describes a sharp pattern in average lab measurements across a huge population, not a sudden collapse in any one woman’s health. Most of the changes are gradual once you zoom out to a single lifetime — the surprise is how tightly they cluster around the final period when averaged across more than a million people.

    Original Paper
    Title: Population-scale reconstruction of menopause dynamics reveals a physiological cliff at the final menstrual period
    Authors: G. Pridham, Y. Hayut, N. Lavi-Shoseyov, et al.
    Journal: Nature Medicine
    DOI: 10.1038/s41591-026-04614-0

    A Million Women, 300 Million Lab Tests

    The study, led by systems biologist Uri Alon and colleagues at the Weizmann Institute of Science in Israel, set out to solve a surprisingly practical problem: almost no medical record states the exact date of a woman’s last period, so age alone has long stood in as a substitute — a poor one, since two 51-year-olds can be years apart in their reproductive timeline.

    The team’s workaround, borrowed from a technique astronomers use to sharpen blurry telescope images, does not try to pinpoint any individual’s personal menopause date. Instead, it mathematically “deblurs” population-wide data — more than 300 million blood and urine tests from over one million women — to recover a clear, averaged timeline of how each lab measurement moves in the years before and after the final period, even though most records never say exactly when that period occurred.

    They applied the method to two large, independent datasets: the US National Health and Nutrition Examination Survey (NHANES), a cross-sectional health study running from 1999 to 2022, and medical records from the Israeli health insurer Clalit, covering roughly 1.3 million women aged 30 to 70 between 2004 and 2024. Earlier menopause research mostly relied on small longitudinal cohorts that followed a few hundred women for a few years, which made it hard to separate ordinary aging from changes tied specifically to the hormonal transition. Lining up test results by time-to-final-period instead of calendar age, across two very different countries and health systems, let the team see a pattern that age-based comparisons alone had obscured.

    The Cliff: Over Half the Markers Shift

    Of 90 routine laboratory measurements tracked in the US dataset, 52 showed a statistically significant, abrupt shift clustered tightly around the final period — not a slow drift over years, but a change concentrated in a narrow window. The affected measures spanned sex hormones, bone metabolism, liver enzymes, kidney function, blood lipids, and general blood chemistry.

    Crucially, men in the same dataset showed no comparable jump at an equivalent age; their values drifted gradually over decades. The authors take this as evidence that the cliff is a genuine signature of the menopausal transition itself, not simply a marker of growing older.

    Researchers describe the pattern as a “step-like physiological cliff” that unfolds within roughly a year of the final period.

    Hormones Begin Shifting Years Earlier

    The cliff at the final period is not where the story starts. Hormonal change begins quietly more than a decade earlier: anti-Müllerian hormone (AMH), a marker of remaining egg supply, begins falling rapidly about 15 years before the final period; follicle-stimulating hormone (FSH) starts rising roughly 14 years before; and estradiol, the main form of estrogen, begins its decline about 12 years before.

    Bar chart showing AMH, FSH, and estradiol begin shifting 12 to 15 years before the final menstrual period
    Source: created based on data from Pridham et al., Nature Medicine (2026)

    By the time the final period itself arrives, these hormonal systems have already been shifting for a decade or more. The final period appears to mark an acceleration — a cascade into bone, liver, and cardiovascular systems — rather than the starting gun for the whole process.

    Bone, Liver, and Heart Markers Shift

    Across the 90 tests, jump sizes ranged from 0.1 to 1.4 standard deviations — a statistical measure of how far a test’s value moves, not a literal percentage change. The biggest jumps clustered in bone-related tests (including bone mineral density), liver tests, and lipid measures such as cholesterol, which the authors note are tissues with strong, well-documented sensitivity to estrogen. Separately, the same researchers found that the rate at which women are newly diagnosed with osteoporosis and cardiovascular disease accelerates right around the final period too — a pattern that, taken together with general background data showing roughly a quarter of women have osteoporosis by age 70, underscores why bone health is a major focus of menopause research, even though this study cannot say the lab-marker jump directly causes any individual case.

    Not every change points downward: iron and red-blood-cell markers actually improve and anemia becomes less common — consistent with the simple fact that monthly menstrual bleeding has stopped. It is one of the few shifts in the “healthier” direction, and the researchers note it lines up with declining rates of anemia in the same population.

    For an individual woman, the practical upshot is that the final period looks, in this data, like a rough marker for when several otherwise-unrelated health measures tend to shift together — not proof that any one woman’s bone scan, cholesterol panel, or liver test will change on cue, since individual biology varies widely around any population average.

    Could Hormone Therapy Blunt the Fall?

    Among women using menopausal hormone therapy, around half of the 80 tests compared showed significantly smaller shifts than non-users — especially bone, liver, and kidney markers — and in media interviews Alon described the therapy as appearing to “erase most of the bone cliff and much of the heart marker cliff.” But the comparison is observational, not a clinical trial: only a small share of women in the dataset used hormone therapy, so the difference could partly reflect who chooses or has access to treatment rather than the treatment itself. Hormone therapy also is not appropriate for everyone, including women with a history of certain cancers, blood clots, or untreated high blood pressure, and the authors say dedicated randomized trials are still needed to confirm any protective effect.

    It’s a reminder that this kind of question — whether acting earlier can blunt age-related decline — keeps coming up across longevity research, including in an unrelated 12-year study that found a MIND-style diet was linked to years of slower brain aging. In both cases, the honest answer is that it will take dedicated, prospective trials to know for sure.

    What Experts Say Is Still Unknown

    Outside researchers welcomed the scale of the data while urging caution about the framing. JoAnn Manson of Harvard Medical School said the study “confirms the profound physiological changes” around the final period, while Rebecca Thurston of the University of Pittsburgh called hormone therapy “not a magic bullet” and emphasized healthy lifestyle habits and social connection alongside any medical treatment. Martha Hickey of the University of Melbourne cautioned that the “cliff” language could be “potentially alarming for women,” noting that the study does not show a dramatic physical or mental decline for most people.

    The study itself is observational and cross-sectional, meaning it shows associations rather than proven cause and effect, and it cannot fully separate menopause-specific change from ordinary aging. Large gaps remain in the underlying data, and the hormone-therapy subgroup was small. What it does offer is a new way to study when menopause-linked changes emerge and how they connect to later health outcomes — the authors themselves frame it as extending the window for potential preventive care back by almost a decade, and as a strategy that could be applied to other hard-to-time biological transitions, such as puberty. Whether that translates into earlier screening or better-timed treatment for any individual woman is the next question, not something this study has already answered.

    Sources: Nature Medicine, ScienceAlert, Newsweek

  • [Science] Climate Change Strengthened Hurricane Polo More Than El Niño, Study Finds

    [Science] Climate Change Strengthened Hurricane Polo More Than El Niño, Study Finds

    When Hurricane Polo intensified into one of the strongest and longest-lasting Category 5 hurricanes recorded in the eastern Pacific in September 2026, an exceptionally strong El Niño seemed the obvious explanation. But a rapid scientific analysis released on October 15 found that human-caused climate change had an even greater influence than El Niño on the ocean and atmospheric conditions that allowed Polo to become so extreme.

    The distinction matters because El Niño is a temporary climate pattern, while human-caused warming keeps raising the planet’s long-term temperature baseline. That means conditions capable of supporting an exceptionally intense hurricane can keep becoming more likely, even in years when El Niño is absent altogether.

    原論文情報 / Original Paper
    Title: Effect of climate change at least as large as El Niño in strengthening Hurricane Polo
    Authors: Friederike Otto et al. (World Weather Attribution / Climate Central)
    Journal: World Weather Attribution rapid report, Grantham Institute, Imperial College London (not yet peer-reviewed)
    DOI: 10.25560/144926

    A Record-Breaking Storm, Dissected

    Hurricane Polo intensified explosively over the eastern Pacific in late September 2026, with maximum sustained winds climbing by roughly 90 knots (about 167 km/h) in 24 hours — a jump the US National Hurricane Center called “truly remarkable.” The storm peaked at about 165 mph (265 km/h), Category 5 strength, and the Associated Press described it as the longest-lasting Category 5 storm on record in the Pacific. Polo went on to make landfall in Mexico’s Baja California Sur and cross into Sonora, and the flooding that followed killed at least five people across Jalisco and Sonora, according to local reports cited in the WWA assessment; roughly 1,000 people were evacuated in New Mexico over fears a dam could fail.

    As soon as the storm weakened, World Weather Attribution (WWA) — the international scientist network known for analyzing extreme weather events within days of them happening, rather than waiting years for a full peer-reviewed study — teamed up with the nonprofit Climate Central to work out how much of Polo’s power came from decades of ocean warming versus this year’s unusually strong El Niño. The team included researchers based in Mexico, the United States, the United Kingdom, Ireland and the Netherlands, working with partners at Imperial College London, the Royal Netherlands Meteorological Institute (KNMI) and the Red Cross Red Crescent Climate Centre.

    Three Ways to Measure the Effect

    To separate the two influences, the researchers mainly relied on a measure called “potential intensity” — a thermodynamic estimate, built from sea-surface temperature, air temperature and humidity, of the strongest a storm could theoretically become in a given patch of ocean. It is not a prediction of the exact wind speed a real storm will reach, since that also depends on wind shear, storm structure and other factors. The team compared potential intensity in the real, warmed-up world against a hypothetical world without human-caused warming, and separately against a world without this year’s El Niño.

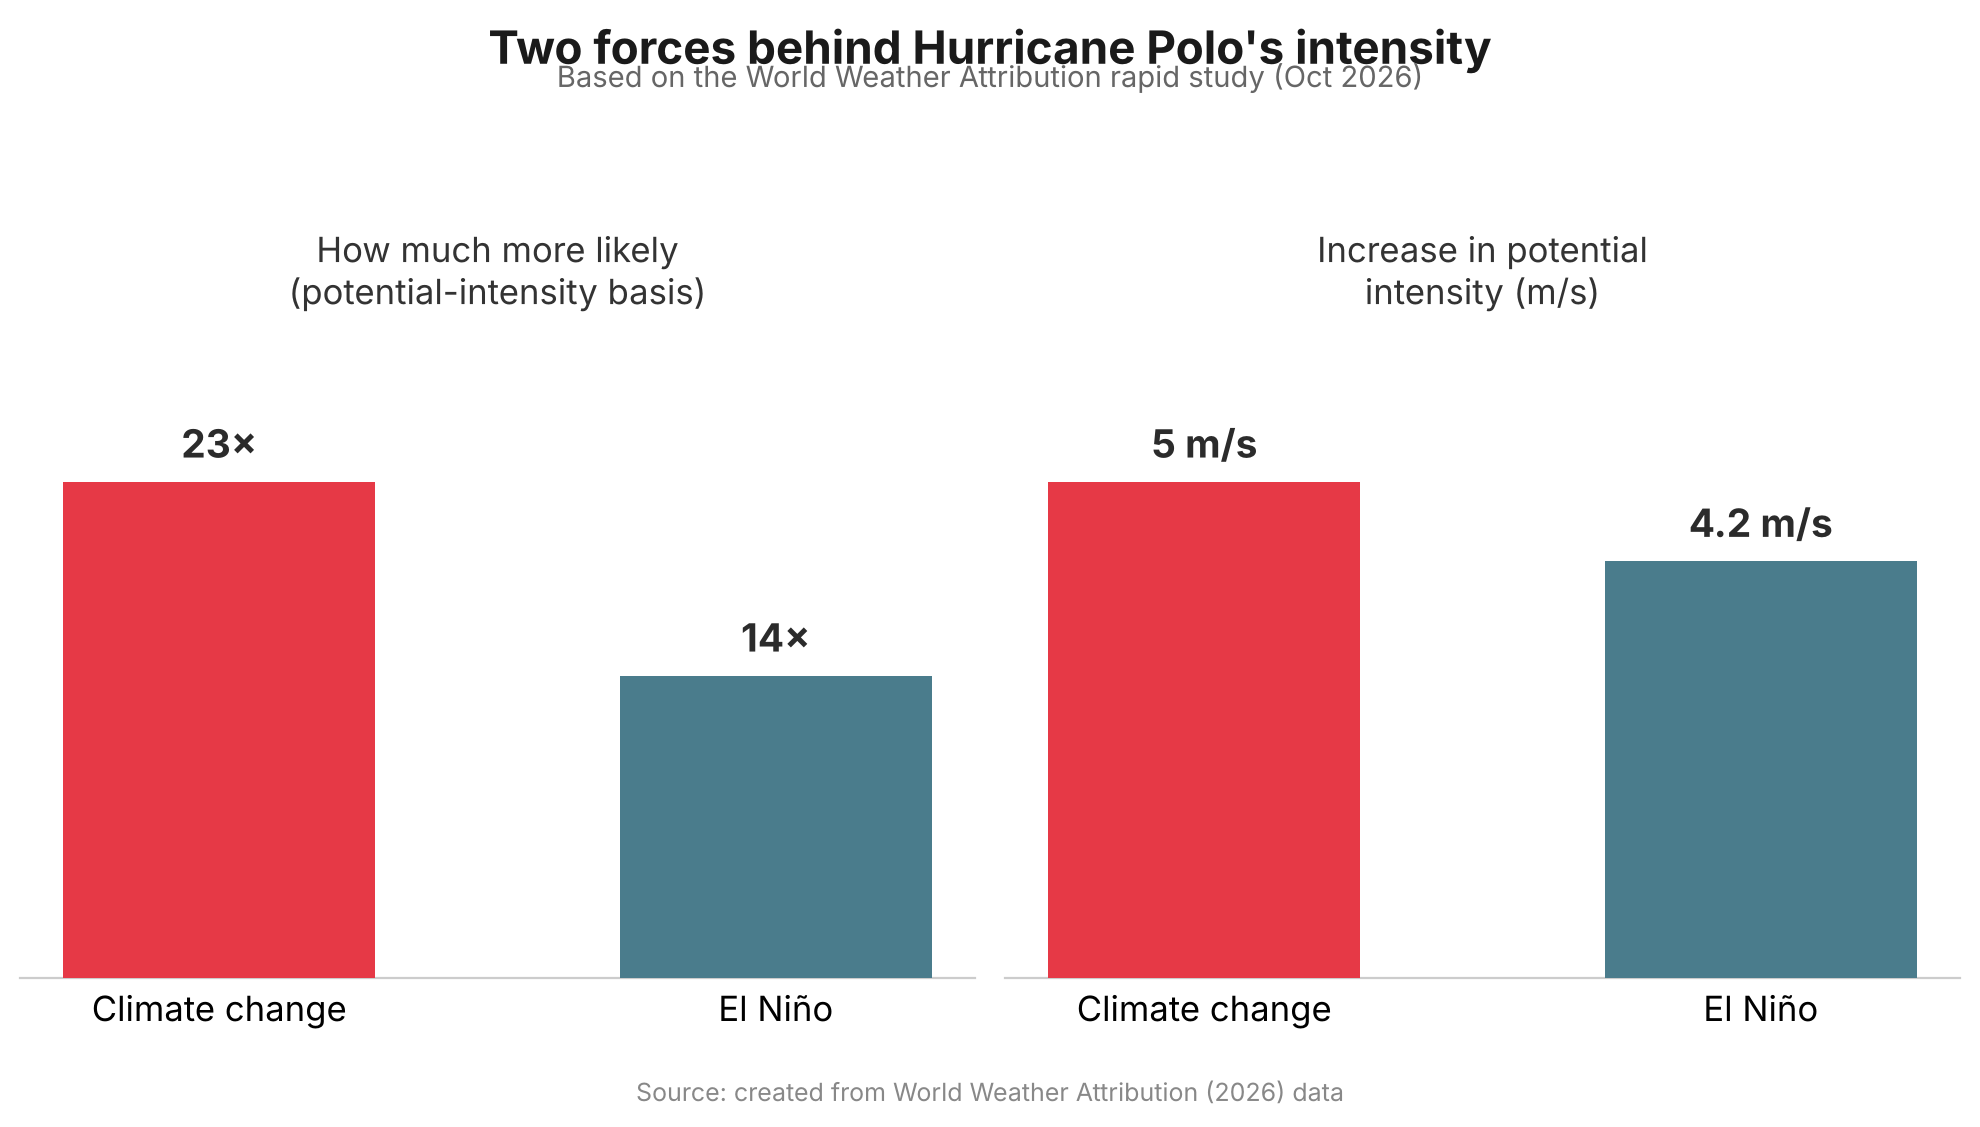
    Bar chart comparing climate change and El Nino's contribution to Hurricane Polo's intensity
    Source: created from World Weather Attribution (2026) data

    The results point the same way on multiple measures. Conditions associated with Polo’s extreme potential intensity were estimated to be about 23 times more likely in today’s climate than in a world without human-caused warming — roughly a 1-in-115-year event — compared with about 14 times more likely from this year’s El Niño relative to neutral conditions, roughly a 1-in-70-year event. In terms of potential intensity itself, climate change added an estimated 5 m/s, versus about 4.2 m/s from El Niño. Separately, the researchers estimated that climate change increased Polo’s actual peak wind speed by about 2.7 m/s, or roughly 6 mph. The ocean water Polo crossed was also assessed on its own: it was about 1.4°C warmer than it would have been in a pre-industrial climate, a level of warmth made roughly 100 to 200 times more likely by climate change.

    Why a Few Miles an Hour Matters

    A few extra miles per hour might not sound dramatic, but it is not a small thing physically. The kinetic energy wind carries rises roughly with the cube of its speed, so a modest increase in wind speed can translate into a disproportionately larger jump in the force a storm can exert — even before accounting for how a particular coastline’s buildings, storm surge and terrain shape the actual damage. That nonlinearity is why hurricane scientists pay close attention to marginal gains in wind speed, and why researchers note that a storm carrying Polo’s extra climate-driven intensity toward a more densely populated coastline could have caused significantly more damage than it did striking a relatively sparsely populated stretch of Mexico.

    El Niño Fades, Warming Doesn’t

    “El Niño comes and goes, but climate change only gets worse.”

    That line, from WWA’s Friederike Otto, captures why the study’s authors consider the finding noteworthy even though El Niño’s own contribution was substantial. El Niño is a natural, temporary swing in Pacific Ocean temperatures that typically lasts anywhere from several months to a year or more before fading. Climate Central’s Daniel Gilford has compared the two influences to a traffic light and an accelerator: in some regions, El Niño can reduce the high-altitude wind shear that would otherwise tear a storm apart, acting like a green light, while warmer ocean water supplies extra heat and moisture that fuel a storm once it starts to intensify. Neither factor guarantees a storm will intensify, but the light will eventually turn red again as El Niño fades. The long-term warming trend, tied to the heat still accumulating in the climate system, does not reset the same way.

    What the Study Can and Can’t Show

    The analysis has not yet been peer-reviewed, which is standard for WWA’s rapid-response studies — the trade-off the group accepts in order to publish within days of a disaster rather than months later. The researchers also tried to quantify climate change’s effect on Polo’s extreme rainfall, but found that available climate models could not reproduce historical rainfall trends in the region closely enough to draw a reliable conclusion, so they left that question open rather than guess.

    Separately, the Associated Press reported that several hurricane scientists not involved in the study — including Jeff Masters, Michael Mann and Carl Schreck — have suggested the climate-change contribution to Polo could be an underestimate, pointing to a 2024 study by Gilford that found climate change added as much as 16 mph to some Atlantic hurricanes. Gilford, a co-author of the new Polo study, told the AP he sees the new analysis as a deliberately conservative one. Either way, the study’s authors are careful to say it shows that a warmer world raised the odds of extreme conditions for this particular storm — not that every future hurricane will necessarily be stronger than the ones before it.

    What This Means Going Forward

    Polo fits a broader pattern this blog has covered before: this year’s global climate indicators report found that seven of sixteen tracked planetary vital signs hit record extremes in 2026, with warming accelerating rather than leveling off. Polo’s real significance may be less about one storm and more about the baseline it was built on. El Niño years will keep arriving and receding on their own schedule, occasionally stacking with warm oceans to produce an especially intense storm. But because the underlying warming trend persists between those cycles, each future El Niño has a slightly warmer ocean to draw on than the last one did — which is exactly the mechanism this study was designed to isolate.

    Sources: World Weather Attribution, The Associated Press (via KSAT), NASA Earth Observatory, Full study (Imperial College London)

  • [Science] What Is Cognitive Offloading? A Simple Guide to How It Works

    [Science] What Is Cognitive Offloading? A Simple Guide to How It Works

    Every time you set a phone reminder instead of memorizing an appointment, or ask a chatbot to summarize a report instead of reading it yourself, you are doing something psychologists call cognitive offloading. The habit itself is ancient, but a wave of recent research is asking a sharper question: what happens to our own performance in the moments when the tool isn’t there?

    Source Paper
    Title: Cognitive Offloading
    Authors: Evan F. Risko, Sam J. Gilbert
    Journal: Trends in Cognitive Sciences, Vol. 20, No. 9, pp. 676–688 (2016)
    DOI: 10.1016/j.tics.2016.07.002

    What Is Cognitive Offloading?

    Cognitive offloading is the use of physical action or an external tool to reduce the mental effort a task would otherwise require. Psychologists Evan Risko (University of Waterloo) and Sam Gilbert (University College London) published an influential review of the concept in 2016, in Trends in Cognitive Sciences, which remains the field’s clearest framework for the idea. Rather than solving a problem entirely “in your head,” you shift part of the work onto your body or your environment.

    It’s a far older behavior than smartphones. Tilting your head to read an upside-down sign, counting on your fingers, or jotting a phone number on a scrap of paper are all forms of cognitive offloading. What has changed is the scale and power of the tools available — calculators, GPS, search engines, and now generative AI assistants can take over not just small chores but entire chains of reasoning.

    The idea is closely related to the “extended mind” thesis, proposed by philosophers Andy Clark and David Chalmers in 1998. They argued that a notebook carried everywhere and consulted automatically can function, for practical purposes, as part of a person’s memory system — their famous example involved a man named Otto who used a notebook the way most people use their own recall. Risko and Gilbert’s later work gave this philosophical idea an empirical, testable framework: when exactly do people choose to offload, and what happens to their underlying skills when they do it repeatedly?

    How It Works: A Decision Loop, Not a Switch

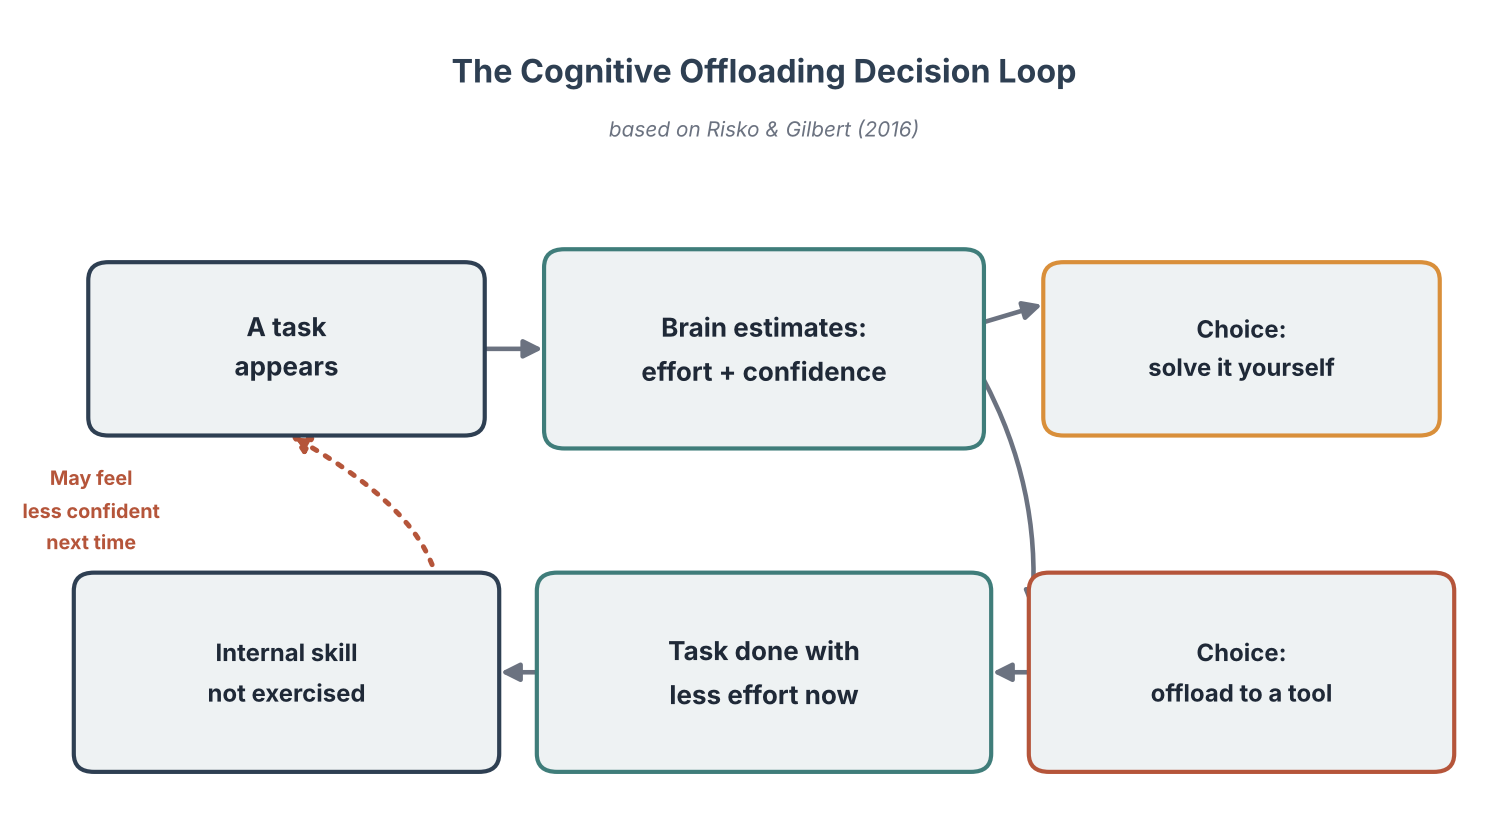
    Imagine being asked to remember five errands on the way home. You could hold them all in mind, or you could write them down. Risko and Gilbert’s framework treats this as a running cost-benefit calculation rather than a one-time choice: the decision depends on how demanding the task feels, how confident you are in your own memory, and how much effort writing the list would save.

    The important detail is that this calculation runs on perceived demand and confidence, not necessarily on actual ability — and people’s self-assessments can be mistaken, so they sometimes reach for an external aid even when they could have managed without it. Whether repeated reliance on a tool gradually changes a person’s confidence or unaided performance over the longer term is a related but separate question, one that is harder to answer than the moment-to-moment decision itself. Offloading isn’t inherently a problem — compensating for a busy week with a written list is a perfectly sensible trade — but it is a trade worth noticing rather than making automatically.

    Diagram of the cognitive offloading decision loop
    Source: created based on Risko & Gilbert (2016), Trends in Cognitive Sciences

    Why It’s Back in the Spotlight Now

    Cognitive offloading has been studied for decades, but generative AI has pushed it from a niche academic topic into a mainstream concern. A widely discussed 2011 study in Science by Betsy Sparrow, Jenny Liu, and Daniel Wegner found that once people believed information would remain accessible online, they remembered where to find it far better than the information itself — a pattern nicknamed the “Google effect.” That study is a useful historical analogy rather than direct proof of what AI chatbots do to the brain: a search engine mainly stores and retrieves information, while an AI assistant can also perform reasoning-like tasks, draft text, and summarize on a person’s behalf, which is a different kind of delegation that researchers are only beginning to study on its own terms.

    The question researchers are now asking is not whether people offload thinking to AI, but how much of their own judgment they lose when the AI isn’t there.

    A 2025 study published in Societies by Michael Gerlich surveyed 666 participants and reported a statistically significant negative correlation between frequent AI tool use and scores on critical-thinking tasks, with younger, more AI-reliant participants scoring lowest. Because the study measured AI use and critical-thinking ability at a single point in time, it cannot determine whether frequent AI use weakens critical thinking, whether people with different existing abilities simply use AI differently, or whether some other factor explains both — but it adds to a growing body of research raising the same question from different angles.

    Everyday Examples You Already Use

    Cognitive offloading shows up in ordinary moments far more often than most people realize. A few familiar examples: writing a shopping list instead of memorizing items, letting a smartphone calendar track every appointment, typing a destination into GPS navigation instead of memorizing the route, and asking a search engine a factual question instead of trying to recall it. In most of these cases the trade is a fair one — a shopping list, for instance, tends to help you finish the errand without costing you much else. The more interesting question researchers are asking is which kinds of offloading are closer to that fair trade, and which carry a greater cost to independent performance later on.

    A 2020 study in Scientific Reports, led by Louisa Dahmani and Véronique Bohbot at McGill University, examined this trade-off directly with GPS. In a sample of 50 regular drivers, heavier GPS use was associated with weaker spatial memory on unaided navigation tasks. A smaller follow-up of 13 of the same participants about three years later found that people whose GPS use had grown the most over that period also showed the steepest declines in spatial memory — a dose-response pattern the authors say is more consistent with GPS use contributing to the decline than the reverse, though they are careful to flag their small sample size and note that the direction of cause and effect is not fully settled.

    Not every example involves memory. Risko and Gilbert’s framework also covers offloading onto the body itself — pointing at an object instead of holding its location in mind, or using a finger to keep a place while reading a long list — and “intention offloading,” where a sticky note or phone alert carries the job of remembering to act later, rather than the job of remembering the information itself. A related but distinct idea is automation, where a system completes part of a task with no decision from the user at all. A GPS app that both tracks your route and reroutes you around traffic without being asked is doing more than simple offloading; it raises its own, separate questions about what happens to a skill when a person is never required to exercise it in the first place.

    What Recent Research Shows

    The clearest recent demonstration comes from a UC Berkeley–led study published in 2026. Researchers ran three randomized trials with 1,222 participants who solved math and reading problems either with or without ChatGPT. Everyone then had to solve a final set of problems entirely unaided. Participants who had previously relied on the AI scored markedly lower on those unaided problems than participants who had worked alone from the start — in one trial, 57% versus 73% correct. Related article: AI Assistance Reduces Persistence and Hurts Independent Performance looks at this study’s full results and the researchers’ own caveats about how far the findings generalize.

    None of this means offloading is simply bad. In a self-reported, non-randomized part of the same study, participants who said they had copied AI-generated answers directly scored the lowest on the unaided follow-up problems (65% correct on average), while participants who said they had used the AI only for hints scored close to those who never used AI at all. Because that comparison is based on what participants reported about their own behavior rather than a randomized condition, it should be read as a suggestive pattern rather than a proven result. Still, it points toward a recurring theme across this research: the question is less whether to offload and more how — leaning on a tool for a finished answer looks different, in its effects, from using it as a scaffold while you still do the thinking yourself.

    Sources: Risko & Gilbert, “Cognitive Offloading,” Trends in Cognitive Sciences (2016), Gerlich, “AI Tools in Society,” Societies (2025), Columbia News on Sparrow et al., Science (2011), American Psychological Association Monitor (2026)

    See also: Why Letting AI Help Can Erode Your Grit and AI Summaries Can Distort Human Memory.

  • A Simulated Brain Circuit Builds Its Own AI-Like Learning System, MIT Finds

    A Simulated Brain Circuit Builds Its Own AI-Like Learning System, MIT Finds

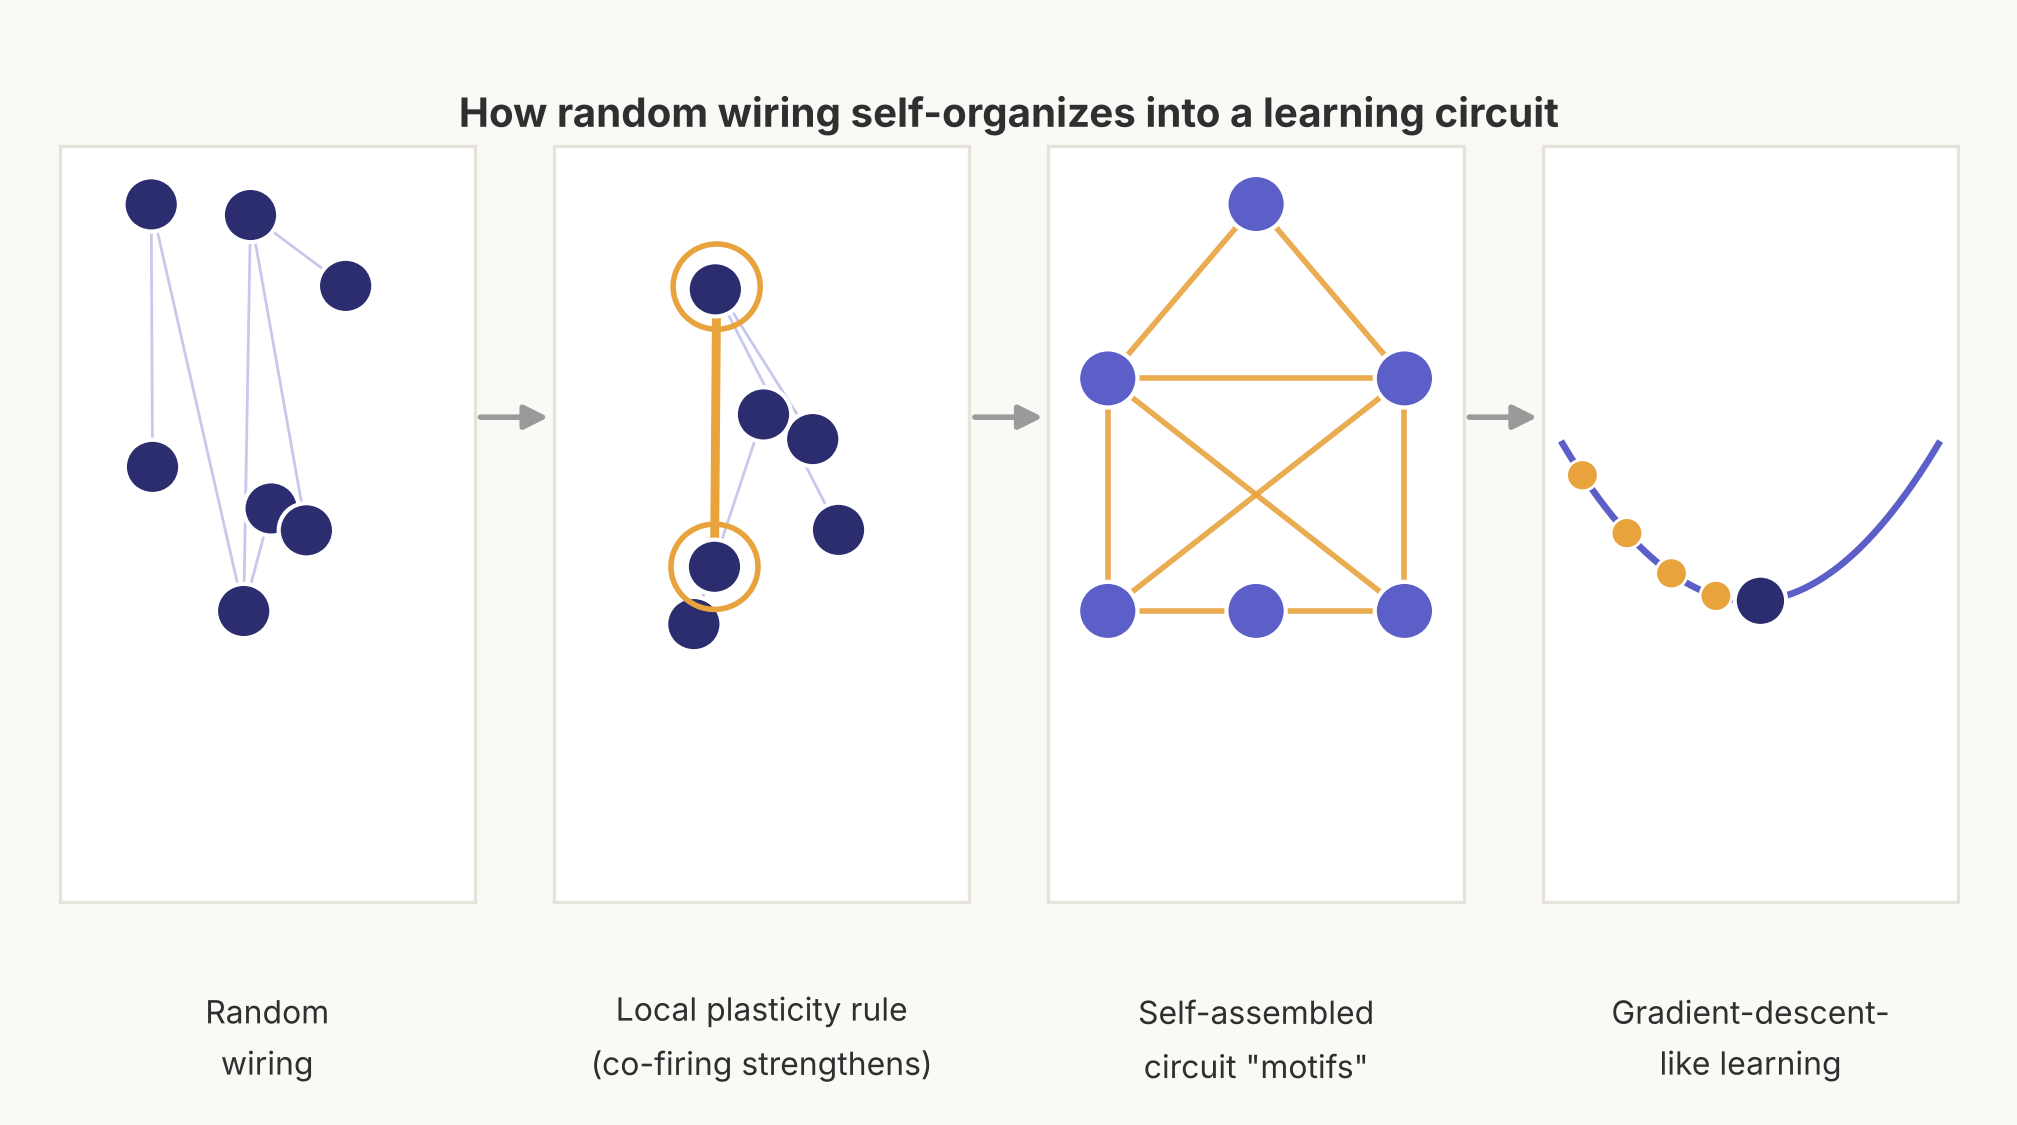
    For decades, neuroscientists have faced a nagging puzzle. Modern AI owes its power to backpropagation, an algorithm that adjusts a network’s connections by propagating error information backward through precisely coordinated connections — a computation with no clearly established equivalent in biological circuitry. Yet some studies have found that activity patterns in trained artificial networks resemble those recorded in the brain’s own visual system, which only sharpens the question of how biological neurons, using only local signals and changing synapses, might approximate something similar. A new study from MIT’s McGovern Institute for Brain Research, published October 9 in the Proceedings of the National Academy of Sciences (PNAS), offers a candidate answer: when simple neuron-like units are wired randomly and left to follow local, biologically plausible plasticity rules, they can spontaneously self-organize into circuits that learn nearly as well as backpropagation does on the tasks tested — without anyone telling them how.

    原論文情報 / Original Paper
    Title: How Biological Synapses Self-Assemble Gradient Learning
    Authors: Qianli Liao, Liu Ziyin, Yulu Gan, et al.
    Journal: Proceedings of the National Academy of Sciences (PNAS)
    DOI: 10.1073/pnas.2606245123

    A 40-Year Mismatch Between Brains and AI

    Modern deep learning owes almost all of its success to backpropagation: a network makes a prediction, compares it with the correct answer, and then propagates that error backward, layer by layer, nudging every connection weight in the direction that would have reduced the mistake. It works brilliantly, but standard implementations depend on precise mathematical relationships between forward and backward connections, plus coordinated transmission of error information through the network. There is no established evidence that cortical circuits implement anything equivalent in its conventional form.

    The puzzle deepened as deep learning matured. Comparisons between the internal activity of backpropagation-trained networks and recordings from biological visual systems have repeatedly found intriguing similarities — not identical, but notably closer than chance would predict. Such similarities do not prove the brain runs backpropagation, but they raise an obvious question: if it does not, what local process could still produce computations that end up looking so much like it?

    Local Rules, No Blueprint

    The MIT team, led by Qianli Liao, Liu Ziyin and Yulu Gan with senior authors Mark Harnett and Tomaso Poggio (and co-author Brian Cheung), approached the question differently from most prior attempts to make backpropagation “more biological.” Instead of designing a circuit by hand and checking whether it could plausibly exist in a brain, they started from almost nothing: layers of neuron-like units connected at random, with no predetermined wiring diagram at all.

    The system runs on local synaptic plasticity rules, including heterosynaptic mechanisms that let a connection change in response to activity beyond that single synapse — a more specific relative of the familiar Hebbian idea that “cells that fire together wire together.” Critically, these rules only need information available locally, at or near a given synapse (the junction where one neuron signals to the next). No unit needs to know what is happening elsewhere in the network, and no single global error signal is broadcast to the whole system.

    Diagram showing random wiring self-organizing into a learning circuit
    Source: created based on findings from MIT McGovern Institute / PNAS (2026).

    Circuits That Wire Themselves

    Left to run under those local rules, the randomly connected units did not stay random for long. Over repeated rounds of activity, the network developed small, recurring wiring patterns the researchers call “self-assembling motifs.” The model’s analysis points to a specific four-synapse motif linking the brain’s ascending, bottom-up pathways with its descending, top-down pathways — a concrete structural prediction that experimentalists can now go looking for in real neural tissue, not a pattern already confirmed to exist there.

    What these motifs do next is the more remarkable part: networks of them self-organize further, so that their combined dynamics approximate a generalized form of stochastic gradient descent — the family of optimization methods that includes backpropagation — without a hand-designed, globally coordinated algorithm directing them. In other words, before the network learned anything from its training data, it first had to build the machinery that would let it learn.

    Starting from random connectivity, local synaptic plasticity rules were enough for the network to assemble circuit motifs whose combined dynamics approximate gradient-descent-style learning.

    Holding Its Own Against Backpropagation

    A biologically plausible circuit is only interesting if it actually works, so the researchers tested their self-organized networks on image pattern recognition and classification tasks. According to MIT, the self-assembled circuits achieved performance comparable to conventional networks trained directly with backpropagation on the tasks tested. The MIT News announcement does not report specific accuracy figures or benchmark datasets — those details sit in the full PNAS paper — so the result is best read as evidence that self-organization carried no obvious cost on this particular test, not as a claim that it matches backpropagation across deep learning in general.

    That matters because it suggests biological plausibility and computational competence are not necessarily in tension. For years, biologically inspired alternatives to backpropagation have often underperformed it on real tasks. A circuit that assembles itself from random wiring and still competes with backpropagation on the tasks it was tried on narrows that gap, at least in this one demonstration.

    A Prediction Neuroscientists Can Go Test

    The researchers are careful to note that a self-organizing network learning like this does not prove the human brain learns this way — it is a candidate mechanism, not a confirmed one. But unlike many theoretical proposals in computational neuroscience, this one comes with a concrete, falsifiable prediction: if the brain really does something like this, cortical circuits should contain that specific four-synapse motif connecting ascending and descending pathways. Experimental neuroscientists can now search actual brain tissue for exactly that wiring signature, which is what turns an elegant simulation into a testable scientific hypothesis.

    Why It Matters Beyond the Lab

    If the prediction holds up, the payoff would extend in both directions. For neuroscience, a confirmed biologically plausible learning circuit would help explain how the brain adapts throughout life, and could sharpen our understanding of what goes wrong in conditions involving altered learning or memory, as well as inform the design of future brain-computer interfaces that need to interact with the brain’s own learning rules rather than fight against them.

    For AI, the lesson cuts the other way: today’s networks are built top-down, with every connection and training rule specified by engineers before a single example is seen. A system that can bootstrap its own learning machinery from random wiring and local plasticity rules hints at an alternative path — architectures that configure themselves as they encounter data, rather than ones that are handed a finished blueprint. Liao, Ziyin, Gan and their colleagues frame their result as an early step in that direction, not a finished product, but their work gives both neuroscientists and AI researchers a concrete new question to test: not just how networks learn once they are built, but how learning itself can come preinstalled.

    For more on where artificial and biological intelligence still diverge, see our earlier coverage of how MIT neuroscientists found the brain re-files information the instant you make a decision, a separate finding that is likewise reshaping how AI researchers think about adaptive, flexible learning.

    Sources: MIT News, Proceedings of the National Academy of Sciences (PNAS), arXiv preprint

  • [Science] Kids With Older Siblings Have Different Gut Bacteria — A Clue to Allergies?

    [Science] Kids With Older Siblings Have Different Gut Bacteria — A Clue to Allergies?

    Children with older siblings tend to develop fewer allergies — and new gut-microbiome research may point to part of the reason why. A team led by Japan’s RIKEN institute, together with researchers at five Japanese universities, analyzed stool samples from 903 two-year-olds enrolled in a nationwide birth cohort study, with 684 of them followed up again at age four. The number of older siblings a child had was linked to distinct gut-bacteria “types” and to the levels of health-related metabolites in their stool — and, notably, the association held from infancy all the way through the preschool years, a period earlier studies had largely left unexamined.

    原論文情報 / Original Paper
    Title: Sibling factors associated with gut microbiota and fecal short-chain fatty acids in preschoolers
    Authors: Tanaka Y. et al.
    Journal: Pediatric Research (online, October 14, 2026)
    DOI: 10.1038/s41390-026-05478-3

    Siblings and gut bacteria: what’s the link?

    Epidemiological studies have long reported that children with older siblings face a lower risk of developing allergic diseases. One proposed explanation, the “hygiene hypothesis,” suggests that exposure to microbes picked up from siblings may shape how a child’s immune system develops. But most earlier research focused on infancy or children under three, leaving it unclear whether the link persists into the preschool years — or what pathway might drive it. Sibling composition is tangled up with many other factors, from breastfeeding and diet to daycare attendance and antibiotic use, which has made the relationship hard to untangle. The gut microbiome itself is a hot topic in medicine, linked not just to immunity but to metabolism and long-term risk of allergies, obesity, and autoimmune disease. Families today look very different than they did a generation ago, with more children growing up as only children, so understanding exactly what siblings contribute — and through which biological pathway — has practical stakes well beyond basic science.

    Three gut-bacteria types in 903 toddlers

    The researchers analyzed stool from 903 two-year-olds across five regions of Japan (Chiba, Hyogo, Kochi, Miyagi, and Toyama), using 16S rRNA gene sequencing to profile bacterial composition and measuring short-chain fatty acids and other metabolites. Short-chain fatty acids are compounds gut bacteria produce by fermenting dietary fiber, thought to play a role in gut-barrier function and immune regulation. By grouping samples with similar bacterial profiles, the team identified three broad gut-microbiota “types,” or enterotypes. Type 1 had the lowest bacterial diversity and the lowest fecal propionate levels, with a high proportion of the Ruminococcus (Mediterraneibacter) gnavus group; Type 2 was dominated by Faecalibacterium; Type 3 by Ruminococcus. At age two, Type 1 was most common, accounting for 413 children (46%); by age four, Type 2 had become most common among the 684 children followed up, at 345 (50%) — a shift that itself suggests a toddler’s gut community keeps maturing well past infancy, rather than settling into a fixed state early on. It’s worth noting that this classification reflects differences in microbial composition, not a direct measure of a child’s health status or disease risk. A “low-diversity” label does not, by itself, mean a child is less healthy or more prone to illness; it simply describes which bacterial groups happen to dominate.

    More siblings, lower odds of Type 1

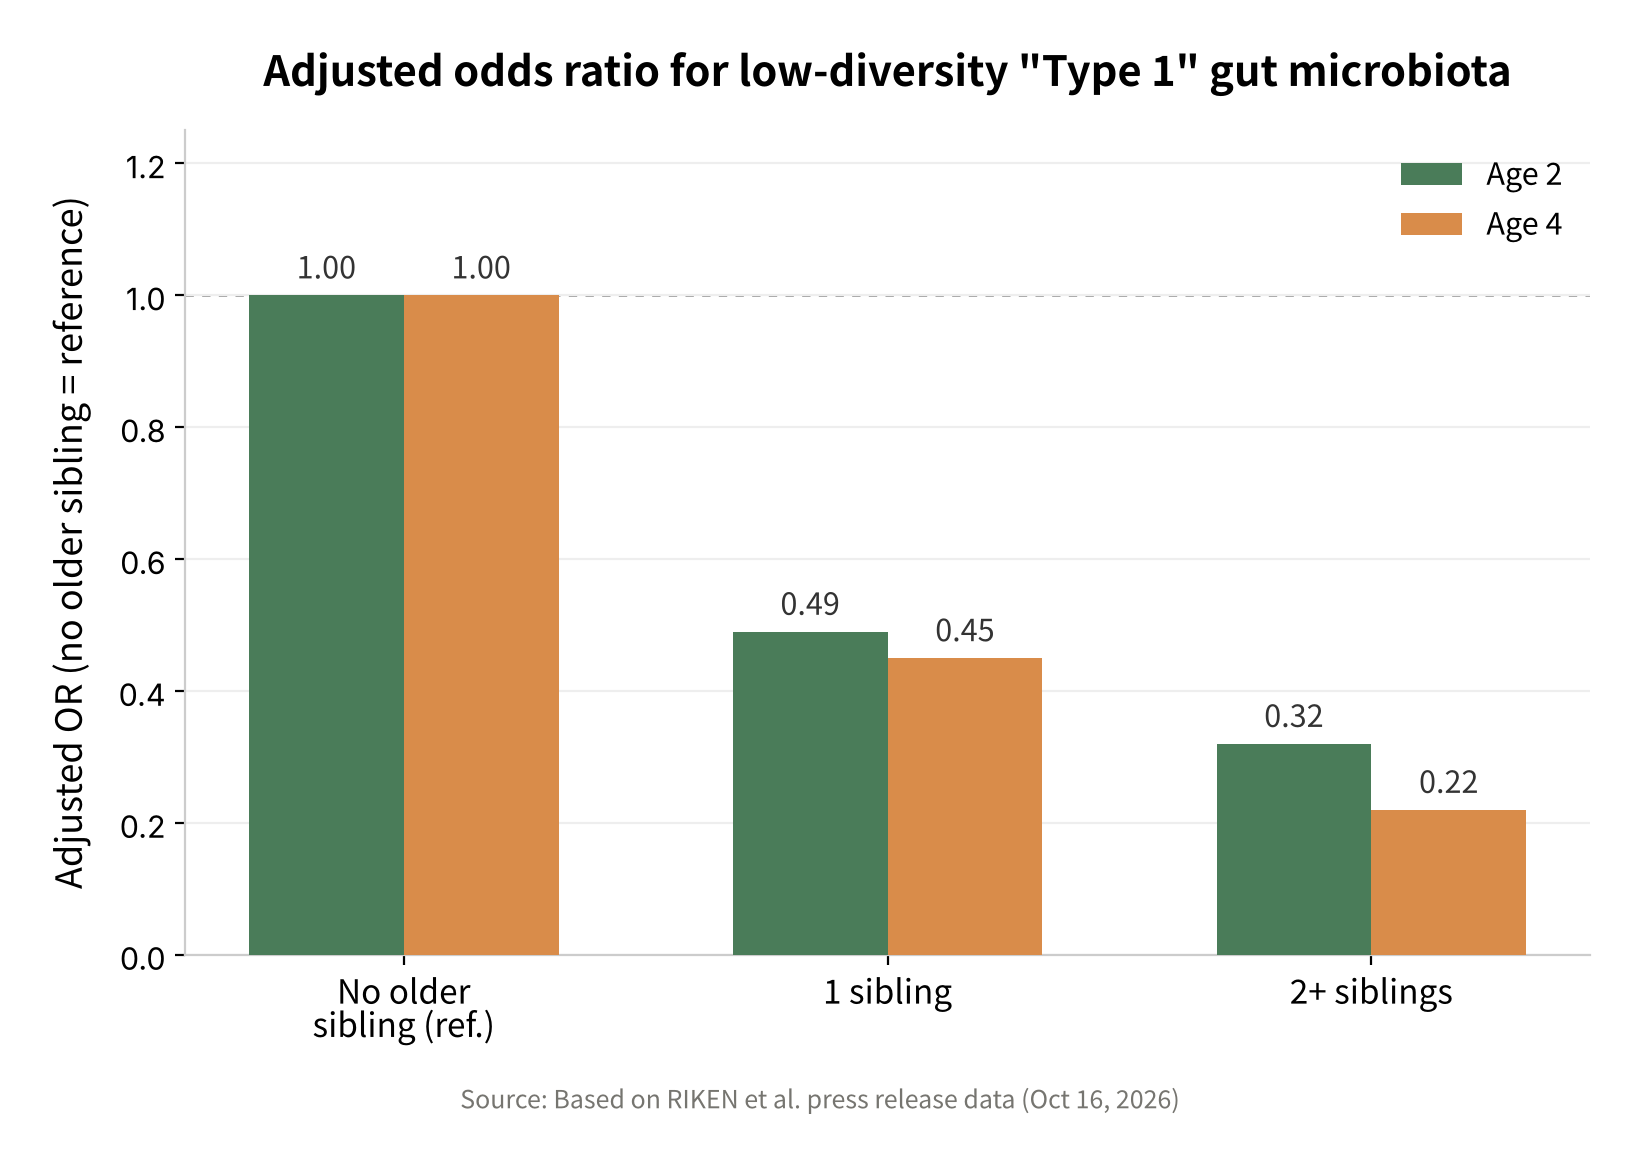
    The study’s central finding concerns how the number of older siblings relates to gut-microbiota type. Compared with children with no older siblings, the adjusted odds ratio for falling into Type 1 (versus Type 2) at age two was 0.49 for children with one older sibling and 0.32 for those with two or more. The same pattern held at age four among the 684 children followed up: 0.45 with one sibling, 0.22 with two or more. In other words, children with two or more older siblings had roughly a third of the odds of being classified as Type 1 compared with those who had none — not a third of the probability of being Type 1, a distinction worth keeping in mind. The association held even after adjusting for socioeconomic status, birth conditions, household size, and pet ownership, among other factors — a level of statistical control that makes it harder to dismiss the finding as a byproduct of some other feature of larger families, such as income or living space.

    Chart of adjusted odds ratio for gut microbiota Type 1 by number of older siblings
    Source: Created based on data from RIKEN et al.

    Metabolite levels followed a related pattern. At age two, several short-chain and branched-chain fatty acids correlated positively with the number of older siblings (with the exceptions of acetate and hexanoate); at age four, propionate alone showed the same association. It’s striking that something as variable from household to household as the number of siblings shows up this clearly in a toddler’s internal biology.

    What breastfeeding and daycare don’t explain

    Because sibling composition correlates with breastfeeding practices, diet, daycare attendance, and antibiotic use, the team ran a mediation analysis to see how much of the sibling-microbiota link these factors could account for — essentially, a statistical test of whether the “obvious” explanations were doing the real work behind the scenes. Most of the factors examined explained little of the association. The one exception: at age four, antibiotic use within the previous three months appeared to explain part of the link, though even that effect was modest.

    That doesn’t mean direct contact with siblings has been proven to be the cause. Unmeasured factors, or pathways the analysis simply couldn’t capture, may also be involved — perhaps the sheer frequency of everyday physical contact between siblings, or subtler lifestyle differences the survey wasn’t designed to pick up. This broader idea — that a child’s early environment can leave a lasting mark on later health — echoes another RIKEN finding on how early-life nutrition shapes long-term lifespan.

    Toward allergy prevention: what’s next

    The research team is careful to stress that the results don’t show that simply having siblings prevents disease. Whether these gut-microbiota differences actually translate into a lower risk of allergies and other conditions still needs to be tested, and causality is a much higher bar than the correlations described here.

    Children with two or more older siblings had roughly a third the odds, at age two, of being classified into the low-diversity gut-bacteria type compared with children who had none.

    The team plans to investigate next whether the sibling-linked changes in gut bacteria and metabolites actually translate into measurable differences in allergy outcomes, and whether specific bacterial groups or metabolites turn out to matter more than others. As a growing share of families raise only children, research like this could eventually offer clues toward interventions — dietary, probiotic, or otherwise — that help shape a healthy gut environment regardless of whether a child happens to have siblings at all.

    Sources: RIKEN press release, Pediatric Research (original paper)

  • [Science] Why Letting AI Help Can Erode Your Grit, Berkeley Study Finds

    [Science] Why Letting AI Help Can Erode Your Grit, Berkeley Study Finds

    A chatbot that hands you the answer can make a hard problem feel easy — until the chatbot is gone. A new study from researchers at five universities found that people who solved problems with an AI assistant performed worse on the next problems, once that assistant was taken away, than people who had worked through the very same problems alone from the start. The gap showed up after roughly 10 to 15 minutes of AI-assisted problem-solving, and it held across three separate experiments involving 1,222 recruited participants — a pattern the authors say raises real questions about whether leaning on AI for answers can undermine people’s ability, or willingness, to solve problems on their own.

    Three Experiments, One Pattern

    The team — Grace Liu, Brian Christian, Tsvetomira Dumbalska, Michiel A. Bakker and Rachit Dubey, drawing on UC Berkeley’s Center for Human-Compatible AI along with Carnegie Mellon University, MIT, the University of Oxford and UCLA — ran three randomized controlled trials totaling 1,222 recruited participants (307, 585 and 168 after some participants were excluded under the researchers’ prespecified criteria). In the first experiment, 354 people were recruited to solve 12 basic fraction problems; half worked alone throughout, while the other half could ask a ChatGPT assistant, built on GPT-5, for help — before everyone, AI group included, had to solve three further problems entirely on their own. A second experiment repeated that design with 667 people, and a third, with 201 participants, swapped the math problems for SAT-style reading comprehension questions.

    In every version of the study, the early pattern looked encouraging: while they still had access to the AI, the assisted group solved problems faster and scored higher than the group working alone — exactly what you would expect from a capable assistant. The twist came in the second half of each session, once the AI was removed and everyone, including the AI group, had to finish the rest of the problems unaided.

    The Numbers Behind the Finding

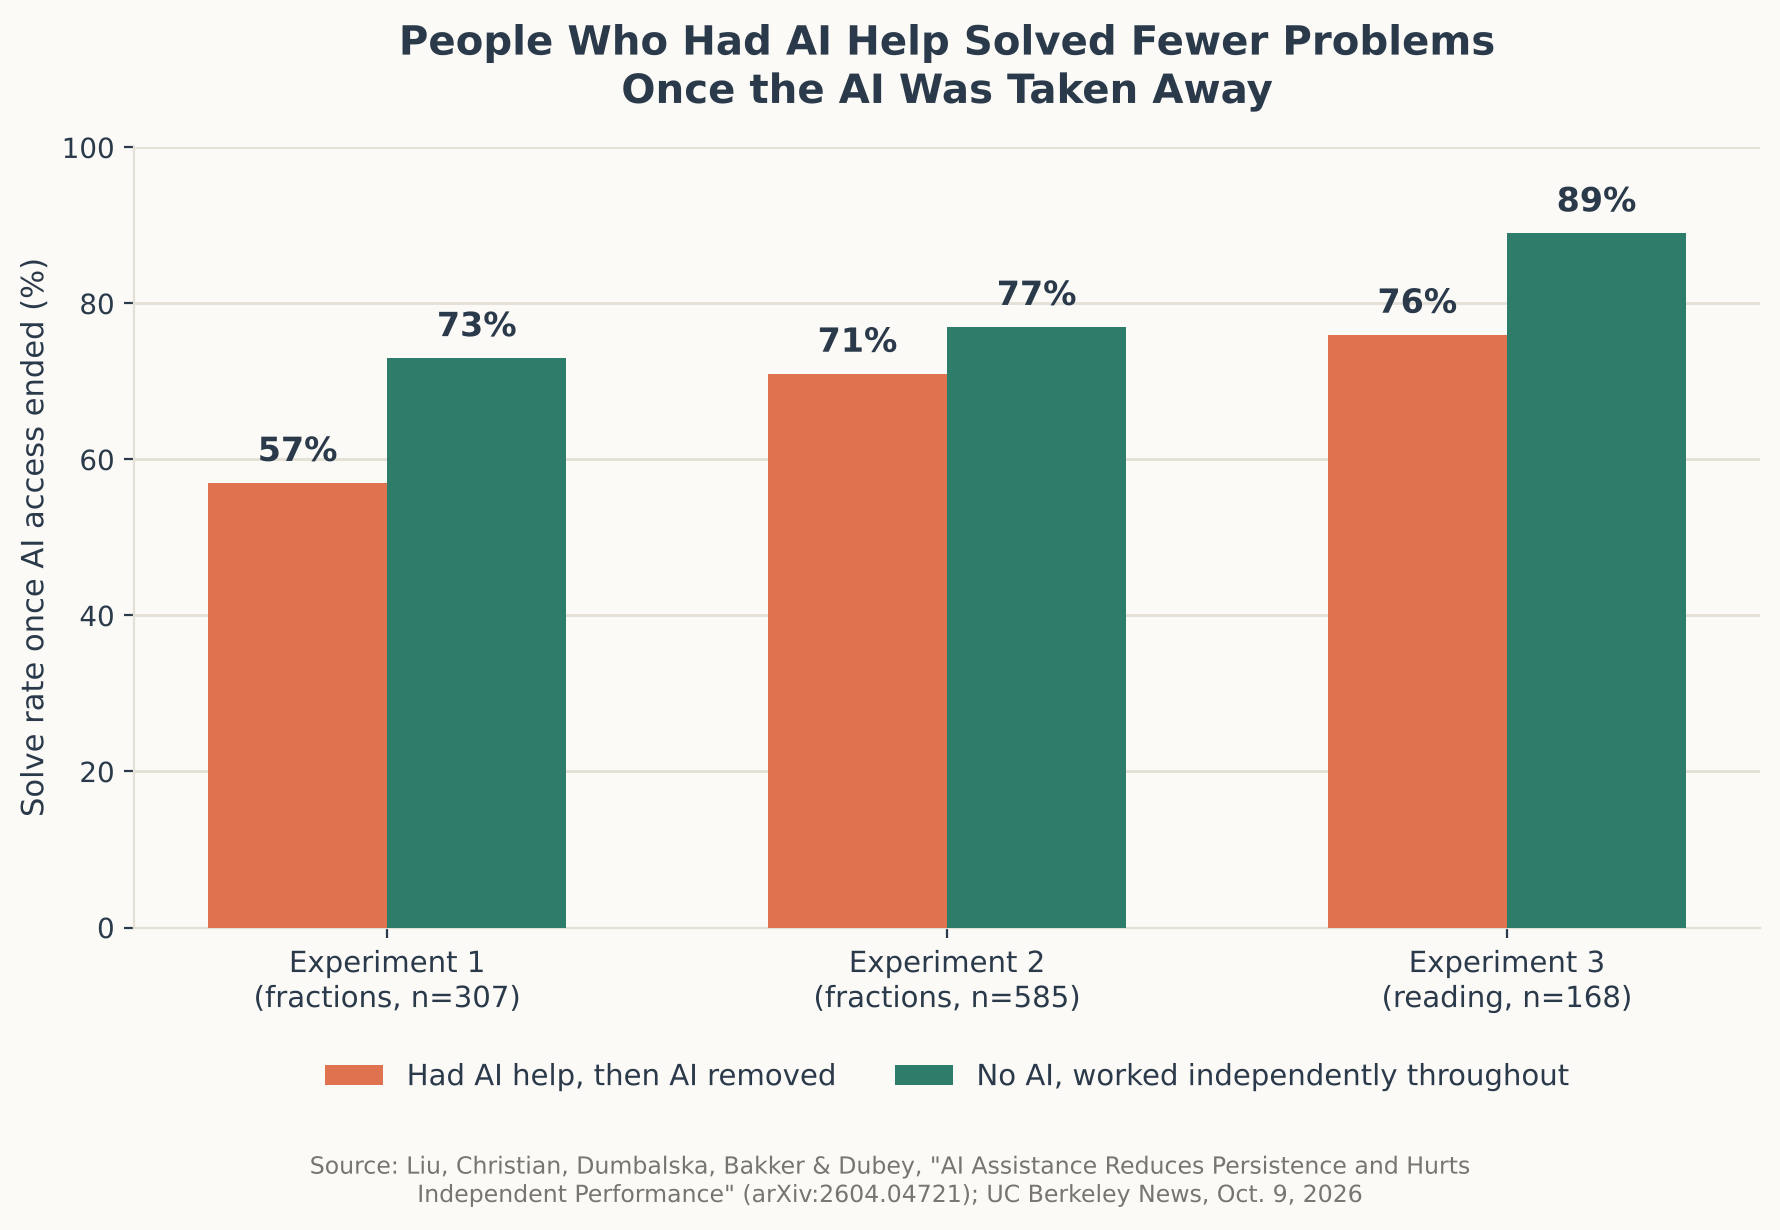
    Once AI access ended, the previously assisted group fell behind the group that had never used it, and the gap was consistent across all three experiments. In the first fraction experiment, the former AI group answered an average of 57% of the three final problems correctly, versus 73% for the no-AI group — a statistically significant difference (p < 0.001). The larger replication of the same design found a smaller but still reliable gap: 71% versus 77% (p = 0.02). In the reading-comprehension experiment, the difference widened again, to 76% versus 89% (p = 0.007).

    Bar chart comparing solve rates after AI was removed across three experiments
    Source: data from Liu, Christian, Dumbalska, Bakker & Dubey (arXiv:2604.04721) and UC Berkeley News

    Giving up altogether followed a similar trend. In the first experiment, 20% of the former AI group skipped a problem rather than attempt it, compared with 11% of the no-AI group. The pattern was weaker in the larger replication (10% versus 7%, not statistically significant) but reappeared clearly in the reading task, where 8% of the AI group skipped questions versus just 1% of the control group. A closer look at how participants said they had actually used the AI while it was available sharpened the picture further, though this part of the analysis was observational rather than randomized, since people were not assigned to copy answers or ask for hints: those who reported simply copying the AI’s finished answers fared worst afterward, averaging just 65% correct on their own, while those who said they used the AI mainly for hints showed no statistically significant gap from people who never touched AI at all.

    Participants were randomly assigned to the AI or no-AI condition, and the larger replication added a pretest to check the groups further: accuracy and the tendency to skip a problem did not differ significantly between groups beforehand, which strengthens the case that the later gap reflects the AI condition itself rather than pre-existing differences between participants. In that same larger replication, participants were also asked how they had actually used the AI while it was available. A small slice, about 12%, said they had barely used it despite having access, and this group performed about as well afterward as people who never had AI access at all — reinforcing the idea that it is the degree of reliance on AI, not mere availability of it, that predicts the later drop-off.

    “It’s a striking finding, but in a way it supplies ammunition for a story that a lot of us kind of feel in our gut.” — Brian Christian, UC Berkeley

    What Might Explain the Pattern

    The authors propose two explanations, while cautioning that their experiments were not designed to prove which one is doing the work. The first is a kind of expectation mismatch: once someone gets used to near-instant answers, grinding through a problem by hand can suddenly feel disproportionately slow, which may make people more willing to give up rather than push through. The second is the loss of what the researchers call “productive struggle” — the idea that difficulty itself is not simply an obstacle to route around, but part of how people practice and strengthen the skills a problem requires. Bypass that effort often enough, the argument goes, and there may be fewer chances for those skills to get built in the first place.

    It’s a different mechanism, but this study joins a related question this site has covered before: Georgetown University researchers recently found that AI-generated summaries of events can distort people’s memory of what actually happened. That study is about memory rather than problem-solving, but together the two point to a broader pattern worth watching — handing a mental task to AI can carry a hidden cost to accuracy or independent ability, even when it feels like pure convenience in the moment.

    “Not Just Fractions and SAT Problems”

    Christian has been blunt about how far he thinks the implications reach beyond a psychology lab. “This is not a story about fractions and SAT problems,” he said in comments accompanying the study’s release. “This is something that is happening to human knowledge and human expertise.” He described the irony directly: widely used AI assistants, he said, are “often helping us in ways that are kind of unhelpful” — lifting performance on the task directly in front of us while, the data suggest, working against the independent competence we will need the next time no AI is around.

    The caveats matter here. The study measured performance minutes after AI access ended, not months or years later, so it cannot say how long this effect lasts or whether frequent users eventually adapt and recover. The breakdown by how people used the AI — copying answers versus asking for hints — was observational rather than randomized, so it shows an association rather than definitive proof of cause and effect. And all three experiments involved short, one-off tasks completed by paid online participants, a different setting from a student using AI across a semester of coursework or an employee weaving it into daily work.

    What This Means for Using AI

    None of this is an argument for avoiding AI assistance altogether — the same data show it clearly boosted short-term performance while it was available, and for many real-world tasks, getting the right answer quickly is exactly the point. The more useful takeaway from this one study may be about how AI gets used rather than whether: in the self-reported usage data, the steepest drop-off belonged to people who let the AI hand them a finished answer, while those who said they used it mainly for hints or partial guidance looked much closer to the group that never used AI at all. Treating a chatbot more like a tutor that nudges you toward a solution, rather than a vending machine that dispenses the finished one, looks like a reasonable bet for keeping your own problem-solving sharp — though it’s one study, in a narrow setting, and confirming how far that advice travels beyond fractions and reading quizzes will take further research.

    Sources: UC Berkeley News, arXiv:2604.04721, “AI Assistance Reduces Persistence and Hurts Independent Performance”

  • [Science] Earth’s Climate Indicators Hit Record Extremes in 2026 as Warming Speeds Up

    [Science] Earth’s Climate Indicators Hit Record Extremes in 2026 as Warming Speeds Up

    A new annual climate report finds that seven of Earth’s sixteen tracked climate indicators, including ocean heat, sea level, and ice loss, have reached record extremes in 2026. Just as notable, the authors estimate that the rate of global surface warming has climbed sharply over the past few decades. The findings matter well beyond climate science circles: if the recent pace continues, warming thresholds long treated as distant milestones could arrive within the working lifetime of people reading this, not generations from now.

    The Planet, Checked Like a Patient

    The findings come from “The 2026 State of the Climate Report: Challenges and Opportunities,” published on October 14, 2026 in the peer-reviewed journal BioScience. It is the latest edition of an annual series led by William Ripple, a distinguished professor at Oregon State University’s College of Forestry, and Christopher Wolf of Terrestrial Ecosystems Research Associates, with co-authors including climate scientist Michael Mann of the University of Pennsylvania and Johan Rockström of the Potsdam Institute for Climate Impact Research.

    The authors track sixteen “planetary vital signs” to monitor changes in Earth’s climate system. These include atmospheric greenhouse gas concentrations, global surface temperature, ocean heat content (the total heat stored in ocean water, including far below the surface, not just sea-surface temperature), sea level, and ice loss. Alongside these, they track the human activities behind the changes, such as fossil fuel consumption and the growth of renewable energy. Much as a doctor reads blood pressure or heart rate over time rather than relying on one measurement, the point of this framework is to follow a consistent set of numbers year after year, rather than judging the climate by any single dramatic event.

    Record Extremes and a Faster Warming Rate

    Of the sixteen indicators, seven, or 44 percent, are now at record extremes. Atmospheric carbon dioxide exceeded 428 parts per million (meaning about 428 CO₂ molecules per million molecules of dry air) in May 2026, roughly 50 percent above pre-industrial levels. Methane and nitrous oxide, two other greenhouse gases, also reached record levels based on year-to-date 2026 averages, though as the year is not yet complete, these figures remain provisional.

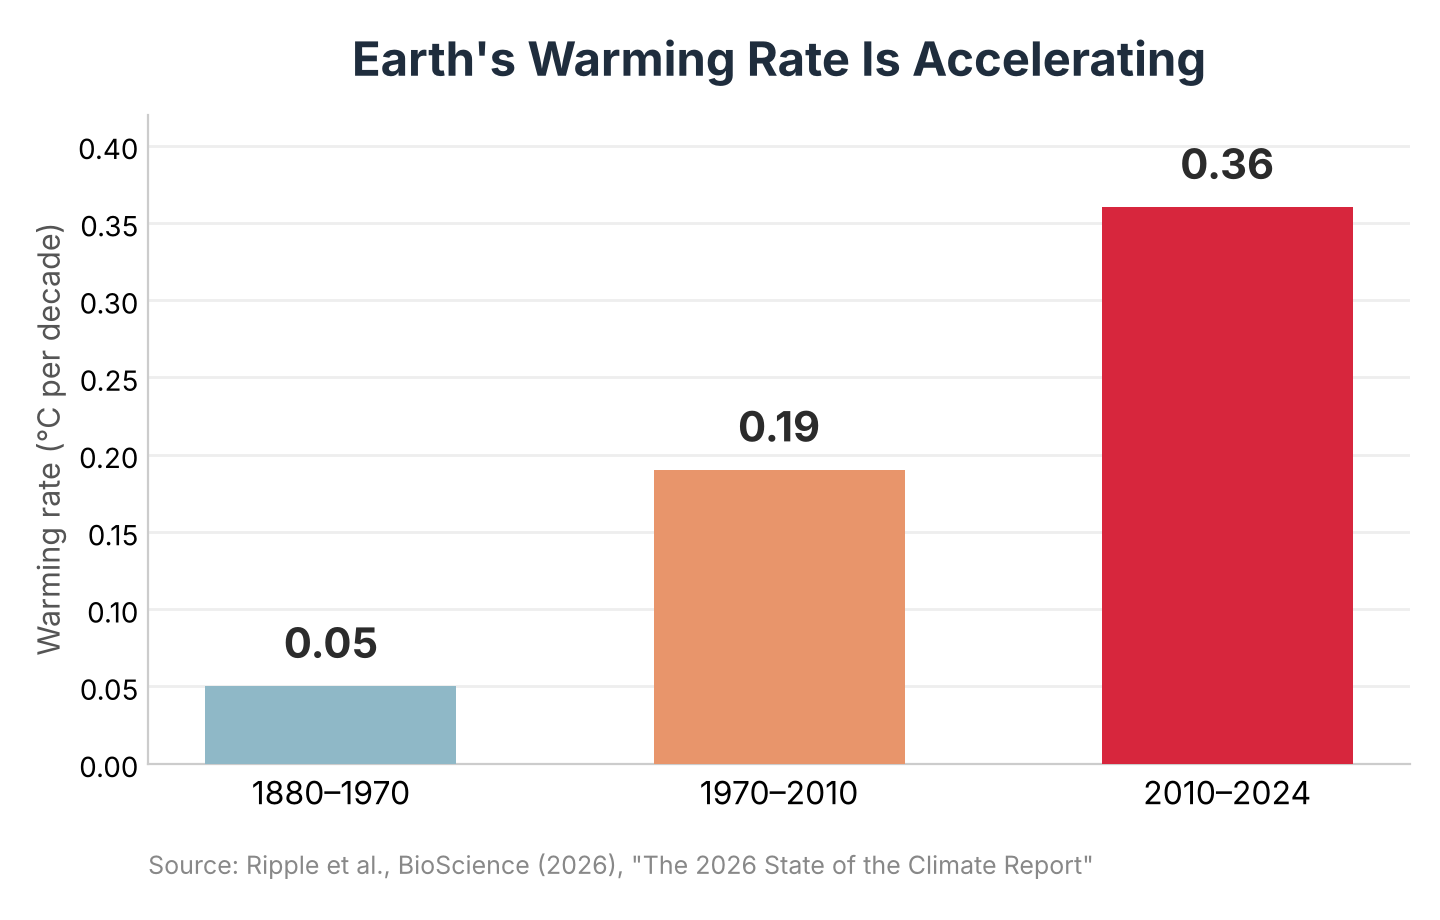
    The report’s warming-rate estimate is one of its most discussed figures. Using a segmented trend analysis, the authors put the rate of global surface warming at roughly 0.05 degrees Celsius per decade between 1880 and 1970, rising to about 0.19 degrees per decade between 1970 and 2010, and then to about 0.36 degrees per decade between 2010 and 2024. That is roughly seven times the earliest rate, though comparing periods of such different lengths calls for some caution: the most recent interval spans only 14 years, so it is more exposed to short-term swings such as El Niño than the 90-year span at the start of the record. Even allowing for that, the direction, a clearly faster recent pace, is consistent across the three periods. If this recent rate were to persist, the authors warn, warming could pass 2 degrees Celsius above pre-industrial levels before 2050; that is a conditional extrapolation from the observed trend, not a guaranteed forecast, since both natural variability and future policy choices could shift it either way.

    The rate of global surface warming rose from about 0.05°C per decade before 1970 to about 0.36°C per decade since 2010 — roughly seven times faster.
    Bar chart showing global warming rate rising from 0.05 to 0.19 to 0.36 degrees Celsius per decade across three periods
    Source: Ripple et al., BioScience (2026), “The 2026 State of the Climate Report”

    The authors describe several indicators as showing accelerating trends or abrupt shifts that could make some future changes harder to anticipate than the steadier patterns of past decades.

    Oceans and Ice Absorb the Impact

    Much of the planet’s response to rising greenhouse gases plays out beneath the ocean surface rather than in the air people breathe. The report finds ocean heat content and global sea level at record highs, while glacier thickness and the mass of the Greenland ice sheet sit at record lows. Energy-related carbon dioxide emissions, meanwhile, passed 41 gigatons for the first time in 2025.

    The overall trend is clear, although scientists continue to refine how they measure ocean heat uptake region by region. A separate study published this month by researchers at the University of Bonn combined satellite and ocean-float data to estimate how much heat different ocean basins are absorbing. For the Indian Ocean during 2005–2015, the new estimate came in at 0.58 watts per square meter, against 1.09 watts per square meter from a commonly used climate reanalysis dataset, ORAS5, a nearly two-fold gap for that basin and period specifically. Xsciens covered that study in more detail here. The gap does not overturn the broader picture that oceans are absorbing most of Earth’s excess heat; it is a reminder that even well-established indicators like ocean heat content keep being refined as measurement methods improve.

    Glaciers are a visible, land-based counterpart to that underwater story. Switzerland’s glacier monitoring network reported that Swiss glaciers lost roughly 5.5 percent of their ice volume in 2026, the second-largest annual loss on record after 2022, a sign that frozen water reserves relied on for seasonal water supply are shrinking at a pace that leaves less room for error in regional water planning.

    The Human Toll, and How to Read It

    The report documents a series of disasters from the past year that illustrate the human costs of extreme weather. Hurricane Melissa, which struck the Caribbean in October 2025, caused 95 deaths and more than 12 billion dollars in damage. A separate storm in November 2025, combined with monsoon flooding in Indonesia, killed 708 people. A June 2026 heatwave across Europe is associated, in a preliminary statistical estimate, with around 14,000 excess deaths, meaning deaths above the number that would normally be expected, calculated from mortality data and a model rather than counted individually; the figure is not yet finalized and could be revised.

    The report’s authors write that these events “were at least partly attributable to climate change,” a deliberately qualified statement: it does not claim that any single storm or heatwave would have been impossible without global warming, but that warming is believed to have raised the odds or intensity of each one to some degree. That is consistent with how formal event-attribution science generally works, comparing the likelihood of an event in today’s warmer climate against a hypothetical world without human-caused warming, rather than issuing a simple yes-or-no verdict.

    Beyond individual disasters, the authors flag rising risk around climate “tipping points”: thresholds beyond which feedbacks could drive changes that become difficult, or in some cases effectively impossible, to reverse on human timescales. Two examples they highlight are a weakening of the Atlantic Meridional Overturning Circulation, the ocean current system that helps regulate temperatures across the North Atlantic region, and the risk of large-scale Amazon rainforest dieback, which the report suggests could be triggered by the combined effects of warming and deforestation at as little as 1.5 to 1.9 degrees Celsius of warming. The authors describe continued warming and interacting feedbacks as raising the risk of a self-reinforcing “hothouse” trajectory, marked by weakening natural carbon sinks and accelerating ice loss, though they present this as an elevated risk worth monitoring closely, not an outcome they predict is imminent.

    A Mixed Picture on Energy

    The report is not uniformly bleak. Low-carbon energy sources collectively supplied about 43 percent of global electricity in 2025, and solar and wind consumption grew by roughly 18 percent over the previous year. For the first time in more than a century, renewable energy sources globally surpassed coal as an electricity source. Battery storage, which helps make intermittent solar and wind power more usable around the clock, is also expanding quickly.

    Yet the authors are blunt that this progress remains far short of what is needed. Global fossil fuel consumption still rose by 0.9 percent in 2025, because rising overall energy demand has outpaced the growth of clean alternatives rather than being displaced by them. On adaptation, the gap is starker still: the report cites roughly 64 billion dollars in international public adaptation finance reaching developing countries in 2024, against an estimated need of 310 to 365 billion dollars per year by 2035.

    What the Report Recommends

    The authors call for pursuing rapid cuts to greenhouse gas emissions alongside faster investment in adaptation and resilience, rather than treating the two as separate tracks. They point to measures such as mangrove and wetland restoration, which both protect coastlines and store carbon, early warning systems for extreme weather, and a stronger emphasis on climate justice so that adaptation funding reaches local and frontline communities rather than only large infrastructure projects. They also point to interactive public tools, such as the En-ROADS climate simulator and the Drawdown Explorer, for evaluating the trade-offs between different policy choices.

    The report does not predict inevitable catastrophe. It documents a climate system under increasing, and in some respects accelerating, pressure, while pointing to specific areas where policy and technology can still change the trajectory. Its underlying message is less a single verdict than a status update: of sixteen vital signs checked in 2026, seven are flashing red, the pace of change is quickening, and the choices made over the next few years will help determine how many more join them.

    Sources: American Institute of Biological Sciences / EurekAlert, Ripple et al., “The 2026 State of the Climate Report,” BioScience (2026), University of Bonn, GPB/NPR on Swiss glacier loss

  • [Science] A Retinal Chip Restores Reading Vision in Macular Degeneration — Gains Hold 3 Years Later

    [Science] A Retinal Chip Restores Reading Vision in Macular Degeneration — Gains Hold 3 Years Later

    A chip about the size of a pinhead, implanted beneath the retina, is still giving some people with an advanced, largely untreatable form of vision loss enough artificial central vision to read letters and words three years after surgery. New follow-up data from the PRIMA retinal implant, presented in a late-breaking session at a major European retina congress and discussed at the American Academy of Ophthalmology’s 2026 annual meeting, suggest that the vision gain patients saw in year one did not fade by year three — it grew slightly instead, an encouraging early sign for a disease that otherwise only gets worse with time, even if the follow-up group is still small.

    Illustration of an eye with a microchip implant
    Illustration: an artificial retinal implant restores light sensitivity where photoreceptor cells have died.

    What the Three-Year Data Show

    The results come from PRIMAvera, a clinical trial that implanted the PRIMA device in 38 people across 17 centers in five European countries, all diagnosed with geographic atrophy, the advanced form of age-related macular degeneration that destroys central vision. The trial had no control group, so every participant received the implant. At the start of the study, their average vision was about 20/460, meaning they could not reliably make out even the largest letter on a standard eye chart.

    At 12 months, 32 of the 38 implanted participants were evaluable, and their eyes had gained an average of 24.5 letters on a standard vision chart, roughly five lines, a result published in a peer-reviewed paper in The New England Journal of Medicine. At 36 months, among the 18 participants still evaluable for vision testing at that later point, a smaller and not necessarily identical group, the reported average gain was 29 letters, nearly six lines, bringing vision to roughly 20/120. Seventy-eight percent of those patients, 14 of 18, had improved by at least 15 letters, or three lines, a threshold researchers consider clinically meaningful. The 36-month figures come from a conference presentation rather than a peer-reviewed publication, so they should be read as encouraging early evidence of durability rather than a final, confirmed picture of long-term outcomes for everyone who receives the implant.

    Chart showing ETDRS vision line gains at year 1 and year 3, and share of patients with meaningful improvement
    Average vision gains grew slightly between year 1 and year 3, and 78% of evaluable patients reached a clinically meaningful improvement.
    “In clinical trials, PRIMA is working better at month 36 than it did at month six.” — Max Hodak, co-founder and CEO of Science Corporation

    Two further findings add context. With the implant switched off, so that patients were relying only on whatever natural vision remained, that baseline vision stayed essentially unchanged over three years, a reassuring sign even though it does not, by itself, rule out subtler structural effects on the retina. Meanwhile, patients’ untreated fellow eyes kept losing vision, as geographic atrophy typically does without any intervention. On safety, researchers reported no new type of safety signal between 12 and 36 months; in the original 12-month study, serious adverse events were concentrated in the weeks after surgery and mostly resolved within two months, though a smaller follow-up group makes it harder to rule out rare or delayed complications.

    Recovering Some Ability to Read

    Geographic atrophy affects more than five million people worldwide and is among the leading causes of severe central vision loss in older adults, though many patients retain some peripheral vision. Approved treatments for the condition can only slow its progression; none had previously been shown to restore central vision that was already lost. That is what makes the PRIMAvera results notable: in the original 12-month study, 27 of 32 assessed participants were able to read letters, numbers or words using the implant, the clearest and best-documented functional outcome. Reports of patients managing longer passages or recognizing faces come from investigators and company accounts rather than a single standardized test, so they are best read as illustrative rather than guaranteed results for every patient.

    Researchers are careful to note that the device does not restore natural eyesight. Patients rely on it only in the implanted eye, need weeks of rehabilitation to learn to interpret its artificial signal, and see a simplified, lower-resolution image rather than full natural detail. Still, for people who previously had no reliable way to read, the functional gain is meaningful, which is part of why Dr. Frank Holz, the lead author of the original NEJM paper, has described the implant as “a paradigm shift in treating late-stage AMD.”

    How the PRIMA Chip Restores Sight

    PRIMA is a wireless chip measuring 2 by 2 millimeters and just 30 microns thick, about half the thickness of a human hair, surgically placed beneath the retina in the area damaged by geographic atrophy. Patients wear glasses fitted with a miniature camera that captures the scene in front of them and projects it onto the chip as pulses of near-infrared light, invisible to the eye, rather than ordinary visible light. A built-in zoom feature lets patients magnify text.

    The chip’s surface works like a miniature solar panel, covered with microscopic photovoltaic pixels that convert the infrared light into small electrical currents. Those currents stimulate the retinal neurons that normally relay visual signals toward the brain, in the same location where vision would ordinarily be processed if the light-sensing photoreceptor cells had not died. The brain then interprets the resulting pattern as a crude, pixelated image.

    The technology was originally developed by Professor Daniel Palanker at Stanford University and is now manufactured by Science Corporation, a neural-engineering company based in Alameda, California. PRIMA received the CE Mark in 2026, clearing it for sale, and the company says it is now commercially available in Europe and the United Kingdom, though in practice access will depend on which hospitals offer the surgery and on local funding arrangements. In the United States, PRIMA remains investigational and has not been approved by the Food and Drug Administration, though Science Corporation says an approval process is underway.

    Why Durability Matters So Much

    For implanted neurotechnology, the central question is rarely whether a device works at first, but whether the benefit lasts. Scar tissue can build up around an implant, electronics can degrade, and the body’s response to a foreign object can gradually blunt a signal that worked well in the first few months. Earlier generations of retinal implants, and some other neural devices, have shown promising short-term results that faded within a few years.

    That is why the 36-month PRIMAvera data matter more than a typical one-year readout. In a disease that normally only gets worse, average vision in the implanted eye did not just hold steady between 12 and 36 months; it continued to improve. “Three years after implantation, the patients who gained vision have kept it, even improved it,” said Dr. Mahi Muqit of Moorfields Eye Hospital and University College London, who presented the data. Researchers attribute part of the extra gain to patients becoming more skilled at interpreting the implant’s artificial signal with practice, and part to evidence that the hardware itself remains stable in the eye over time.

    Who Can Access It, and Who Can’t

    For now, PRIMA is commercially available only in Europe and the United Kingdom, and only for geographic atrophy caused by age-related macular degeneration; it has not been tested as a treatment for other causes of vision loss, such as inherited retinal disease or diabetic eye disease. Even where it is approved, access will likely stay limited at first to specialized retinal surgery centers, given the operation required to place the chip and the weeks of visual rehabilitation that follow.

    In the United States, the device remains investigational, meaning patients can currently obtain it only by enrolling in a clinical trial, if one is available, while the FDA approval process continues. An editorial accompanying the original one-year results in The New England Journal of Medicine described PRIMA as the first approach shown to restore vision, rather than merely slow its loss, in advanced geographic atrophy, a framing that underscores how little direct competition this approach has today, and how much is still being learned about its place in everyday eye care.

    Caveats Behind the Headline Numbers

    The study design leaves real uncertainty. PRIMAvera had no control group, so researchers cannot fully separate the implant’s own effect from a practice effect, in which patients simply get better at using the device’s artificial signal over time regardless of how the hardware is performing. Larger, controlled trials would be needed to settle how much of the measured improvement comes from the chip itself.

    The shrinking sample size is also worth noting: of the 38 people originally implanted, only 27 remained evaluable for safety and 18 for vision at the three-year mark, and the publicly presented data do not explain why the others dropped out of assessment. If patients who were doing poorly were more likely to leave the study, the remaining group could make the device look more effective than it actually is across everyone who receives it.

    Whether PRIMA reaches more patients in the United States, and how it performs in a larger and more varied population, remains to be seen. But for a disease that has long offered people only the prospect of a slower decline, three years of durable, measurable improvement is a meaningful data point, and one that eye specialists are likely to watch closely as the device moves toward wider use.

    Sources: Science Corporation, Newswise / American Academy of Ophthalmology