Tag: Japan

  • [Science] Why Is Japan So Strong in Materials? The Industry Structure and Three Hypotheses, Read Through Cases

    [Science] Why Is Japan So Strong in Materials? The Industry Structure and Three Hypotheses, Read Through Cases

    The chips in a smartphone, the airframe of a jet and the battery in an electric car all get their performance from materials. In materials, Japanese companies hold a majority of world share in a number of fields. This article checks the current picture and the challenges against official documents, lays out the industry structure materials sit in, and then digs into why Japan is strong through three hypotheses and company cases.

    Key data in this article
    • METI, New Materials Industry Vision (interim summary, June 2022): Materials are 20% of manufacturing GDP; Japanese firms hold 70% of photoresist, and one firm (Company A) 80% of rolled copper foil for FPCs
    • METI, Global Niche Top Companies 100 (2020 edition): 113 selected firms: average world share 43.4%, average operating margin 12.7% (manufacturing average 4.8%)
    • Cabinet Office, Materials Innovation Strategy (June 2025): Many materials above 60% world share; names “suriawase-type development” as a Japanese strength

    Where things stand: strength in share and margins

    According to the interim summary of METI’s New Materials Industry Vision (June 2022), materials account for 20% of Japan’s manufacturing GDP and support 220,000 jobs in steel and 940,000 in chemicals. Japanese firms hold 70% of the world market for photoresist, the chemical used to print circuits onto chips, and one company, Company A, holds 80% of rolled copper foil for flexible printed circuits (FPCs), the bendable wiring in smartphones. The Cabinet Office’s Materials Innovation Strategy (June 2025), citing a NEDO survey, also notes many materials with world share above 60%.

    The strength shows in profits as well as share. METI’s 2020 Global Niche Top Companies 100 selected 113 firms from 249 applicants. Their average world share was 43.4% and their average operating margin 12.7%, well above the 4.8% manufacturing average (fiscal 2018). In materials and chemicals alone, the margin was 13.9% and the average share 50.6%.
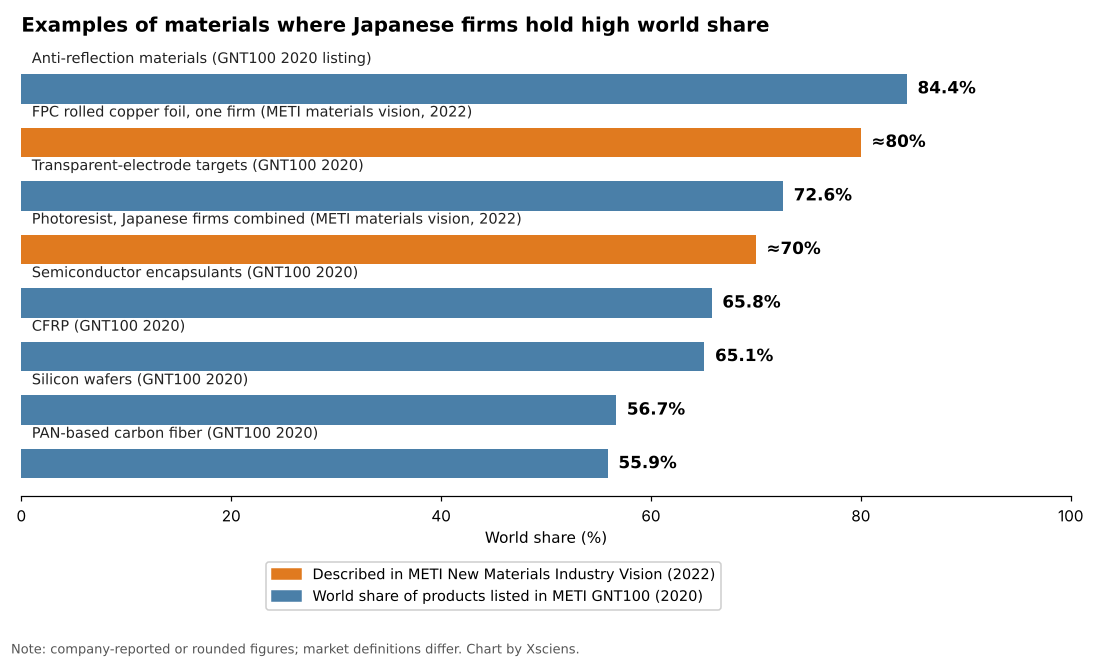
    Bar chart of materials and components where Japanese firms hold high world shares, ranked by share
    Source: Chart by Xsciens based on METI, New Materials Industry Vision interim summary (2022) and METI GNT100 (2020). Orange bars are figures described in the METI vision; blue bars are products listed in GNT100. Some values are company-reported or rounded and market definitions differ, so bars are not strictly comparable.

    There are challenges too. The same METI document shows China’s share of world crude steel output rising from 15% in 2000 to 53% in 2020. The Cabinet Office’s 2025 strategy lists stagnant paper counts, a declining international presence, a shortage of people who can run data-driven materials development (materials informatics, MI), and slow social implementation. NISTEP reports that, on a fractional-count basis, Japan’s Top10% and Top1% adjusted paper counts in chemistry, materials science and basic life sciences fell by 20% or more between 2010 and 2020. PwC Japan’s analysis points to the small scale of high-share businesses, low overseas sales ratios and a “valley of death” between research and commercialization.

    What industry structure do materials sit in?

    Materials are inconspicuous in the final product. The Cabinet Office strategy describes materials as both “constituents of end products and the source of their functions.” Material makers produce functional materials such as films, copper foil and photoresist; parts makers use them in chips and batteries; and finally smartphones, cars and aircraft are completed. Along this chain, material makers face demanding quality and price requirements from downstream industries. METI describes meeting them as the foundation of other industries’ competitiveness.
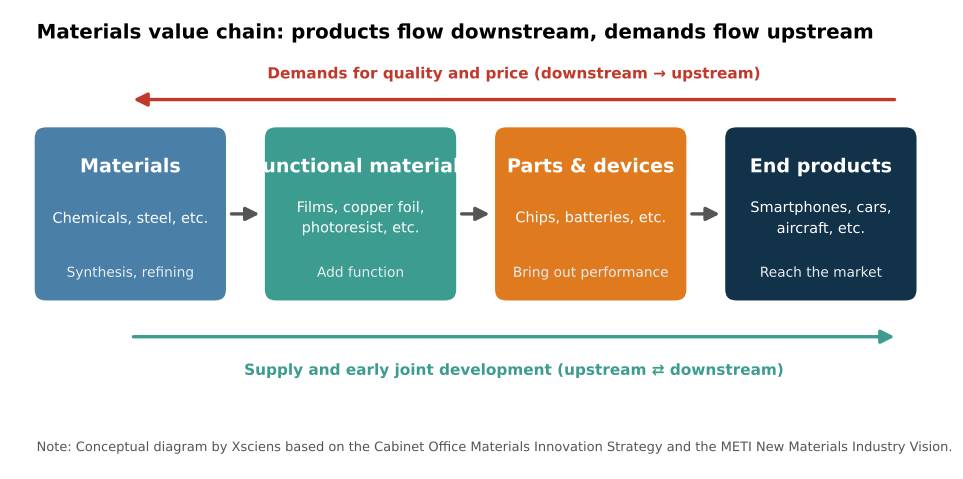
    Diagram of the value chain from materials to functional materials, parts and devices, and end products, with quality and price demands flowing upstream and early joint development linking both ends
    Source: Conceptual diagram by Xsciens based on the Cabinet Office Materials Innovation Strategy and the METI New Materials Industry Vision.

    Sitting there, materials have an impact far beyond their cost. For Ajinomoto’s ABF, an insulating film used in semiconductor packages, a GIGAZINE article of April 2026 reports that it makes up less than 0.1% of the product price, yet its share is close to 100%, and surging demand for AI chips could create shortages. The Cabinet Office strategy likewise says Japan has many items with very high world share that hold an indispensable place in global supply chains.

    Why the hypotheses matter

    Strength in materials does not stay in visible form like equipment or patents. Unless we ask why Japan is strong, we cannot see what to protect or what to build on next. The Cabinet Office strategy names “suriawase-type development” (close tuning with the user), the know-how of evaluation, analysis, processing and synthesis, and strong industry-academia ties as Japanese strengths, and stresses long-term investment because materials R&D takes a long time. From this we organize the reasons into three hypotheses.
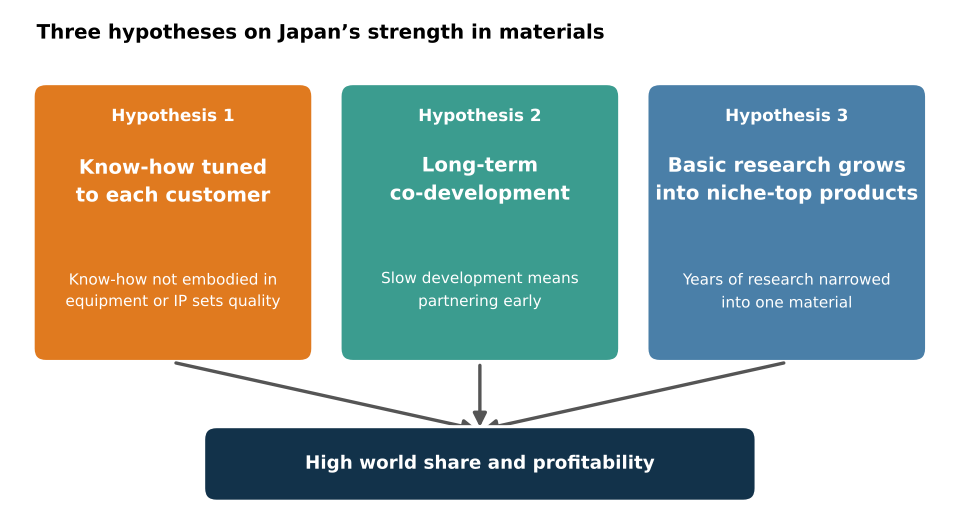
    Concept diagram: know-how tuned to each customer, long-term co-development, and basic research growing into niche-top products lead to high world share and profitability
    Source: Concept diagram by Xsciens based on the cited documents.

    Hypothesis 1 is shop-floor “suriawase”: polishing a product to each customer. Hypothesis 2 is long-term co-development: partnering early with downstream customers and growing a product over years. Hypothesis 3 is that years of basic research grow into niche-top products focused on one material. Below, we look at why each matters and how it works in practice, using a different company for each.

    Hypothesis 1: shop-floor “suriawase” tuned to each customer

    The best conditions for a material differ with each buyer’s process. METI’s document says that “know-how not embodied in equipment or intellectual property is the source of the materials industry’s strength.” Equipment and patents can be bought or studied, but know-how built up in people and organizations is hard to copy from outside. The Cabinet Office strategy also calls evaluation, analysis, processing and synthesis techniques “a mass of know-how.” That is why hypothesis 1 matters: it is a source of resistance to imitation.

    In practice, take TOK (Tokyo Ohka Kogyo), a photoresist maker. Its 2020 integrated report describes its strength as the ability to quickly deliver tailor-made photoresists, fine-tuned to each customer’s needs and each process’s requirements. The performance factors include sensitivity, resolution, etch resistance and purity, and the report says photoresist greatly affects a customer’s quality and yield. TOK is ranked first in the world for semiconductor photoresist, with a 25.6% share by projected 2020 shipment volume.
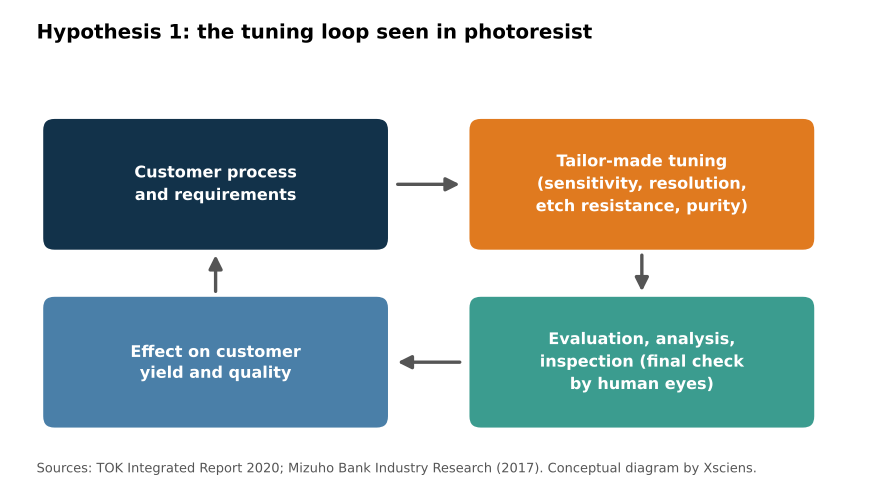
    Loop showing customer process and requirements, tailor-made tuning, evaluation, analysis and inspection, and the effect on customer yield and quality
    Source: Conceptual diagram by Xsciens based on TOK Integrated Report 2020 and the Mizuho Bank Industry Research report (2017).

    A 2017 report by Mizuho Bank’s Industry Research Division names two common strengths of Japanese material makers, the ability to develop products to customer needs and efficient, stable production operations, and says they have prized inspection steps where “in the end, people check by eye” to meet demanding domestic customers. Receive the customer’s requirement, tune, inspect, return. Repeating this loop for years builds up as shop-floor know-how.

    Hypothesis 2: long-term co-development with downstream customers

    Materials R&D takes a long time. The Cabinet Office strategy therefore calls for research and development in which upstream and downstream industries cooperate from the early stages. Partnering with customers early and growing uses together makes a material a lasting part of the customer’s product. That is why hypothesis 2 matters.

    The practice shows in Toray’s carbon fiber. According to Toray’s investor materials, the company signed a 16-year long-term carbon-fiber composite supply agreement with Boeing in 2006. An ITmedia article (February 2009) reports that this was an exclusive contract under which Boeing buys the 787’s structural carbon fiber from Toray alone, and that Toray kept developing carbon fiber for about 40 years while accepting losses, selling it for golf clubs and the like while pursuing aircraft certification. Its model is integrated production from precursor fiber through carbon fiber to prepreg (resin-impregnated sheet). In Nagoya it set up the A&A Center, a technology development site that includes the AMC for automotive uses (opened June 2008) and the ACC for composite product development (scheduled to open April 2009). In the same document Toray projected a world carbon-fiber share of about 37% after its capacity expansion (a 2008 plan).
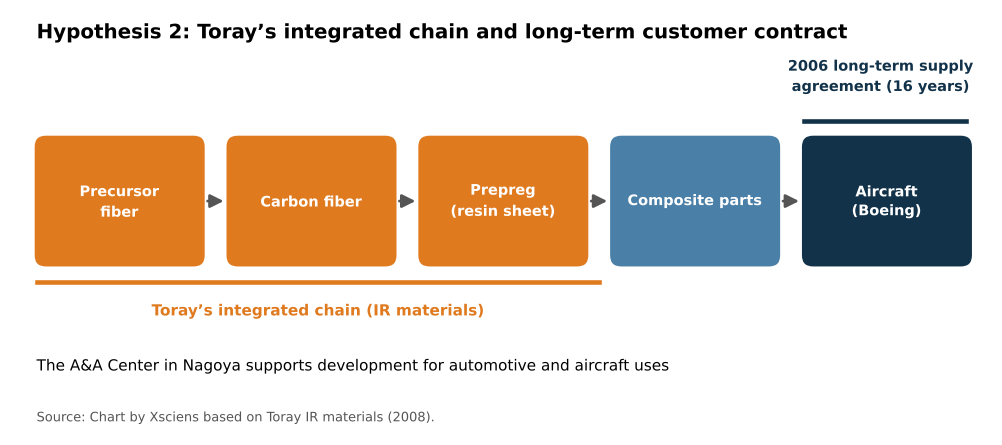
    Flow from precursor fiber to carbon fiber, prepreg, composite parts and aircraft (Boeing), with the 2006 long-term supply agreement
    Source: Chart by Xsciens based on Toray IR materials (2008).

    Looking from material to composite to the customer’s airframe, and promising supply under a 16-year contract: the length of this relationship becomes the base for growing uses together with the customer.

    Hypothesis 3: basic research grows into niche-top products

    Materials research takes years to become a product. The Cabinet Office strategy calls Japan’s materials field one with relatively strong industry-academia ties and, on the principle that “industry is the dojo of scholarship,” seeks to advance social implementation and deeper science together. A path that grows accumulated basic research into products focused on one material is why hypothesis 3 matters.

    The practice shows in Ajinomoto’s ABF. According to the Ajinomoto Group, in the 1970s it continued basic research on insulating epoxy resin using its amino-acid know-how. In the 1990s, as CPUs grew denser and pin counts rose from an early 40 to over a thousand, a new insulating material for circuit boards was needed. As a latecomer, Ajinomoto took on the task of turning an ink-type insulating material into a film. The hurdle was mixing organic matter (epoxy resin and hardener) with inorganic filler and dispersing it evenly, which the research team solved to make a thermosetting film. A major chipmaker adopted it in 1999, and it is still used in leading CPUs. The company offers customers the processing method as a system, including optimized laser drilling and copper plating.
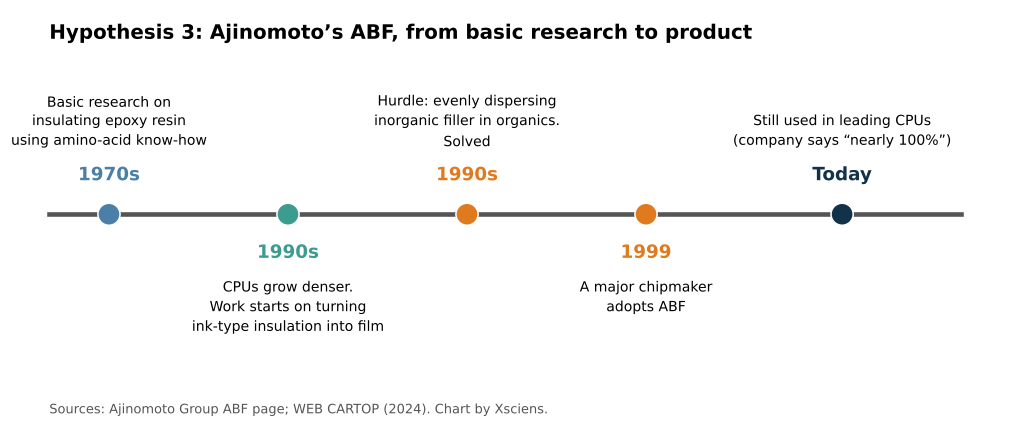
    Timeline of Ajinomoto’s ABF from 1970s basic research through 1990s filming, 1999 adoption, and today
    Source: Chart by Xsciens based on the Ajinomoto Group ABF page and WEB CARTOP (2024).

    WEB CARTOP (June 2024) also reports that ABF’s history begins with amino-acid R&D in the 1970s. It is a case where basic research that began in the 1970s met a market need in the 1990s and became a product. The same flow shows in Akira Yoshino, who shared the 2019 Nobel Prize in Chemistry. According to the Nobel Foundation, the prize was shared with Whittingham and Goodenough “for the development of lithium-ion batteries,” and Yoshino’s affiliations were Asahi Kasei and Meijo University. Corporate and university research came together in a battery product.

    Outlook: keeping the edge

    According to METI, materials industries such as steel and chemicals account for about 80% of industrial CO₂ emissions, so in a decarbonizing world, materials that cut emissions are themselves a competitive asset. The way materials are developed is also changing. METI cites a catalyst developed with Yokohama Rubber in which MI achieved a world-best yield (60–70%) and a catalyst matching the performance of crude-oil-derived tires. The Cabinet Office notes that DeepMind predicted about 2.2 million stable compounds. Turn hypothesis 1’s shop-floor know-how into data, extend hypothesis 2’s customer ties to new uses, and sustain hypothesis 3’s basic research. Whether Japan can overlay all three is the key to the next decade. For an example of basic materials chemistry, see our article Ammonia From Air Under Milder Conditions: Kyoto University and Others Explain Why a Molybdenum Catalyst Works.

    Xsciens Editorial Note

    Japan’s strength in materials is easier to understand as accumulated strength in which three hypotheses overlap, rather than a single cause.

    • Read share figures with definitions and dates aligned. For photoresist, Japanese firms combined are 70% in METI’s document, about 90% in PwC Japan’s analysis, and TOK alone is 25.6% (projected 2020 shipments), so figures differ by source. The GNT100 figures include company-reported values. When comparing, check the source, year and market scope.
    • The three hypotheses are not proof of causation. They are leading views drawn from documents and cases, and we found no study that separates how much each one contributes. TOK, Toray and Ajinomoto are all success stories, and the same path may not apply to every material.
    • The base of the strength is past accumulation, with no guarantee for the future. Ajinomoto’s ABF is a case where basic research that began in the 1970s became a product in the 1990s. If highly cited papers are now declining and materials-development talent is short, the effect may show in a few years.
    • From the editors — the smartphone and battery you use every day are made of layers of materials whose names you may never have heard. Knowing that Japanese firms support a number of them may change how you read the next “new material” headline. Still, strength does not last by itself. Take pride in today’s numbers, and keep an eye on whether investment in research and people continues.

    References for this note: PwC Japan analysis of the chemicals industry (scale of high-share businesses, valley of death), Mizuho Bank Industry Research, “Materials” (2017), ITmedia Business Online (February 2009), WEB CARTOP (June 2024), NISTEP RM329 press release (international paper comparison)

    Sources: METI, New Materials Industry Vision interim summary (2022), Cabinet Office, Materials Innovation Strategy (2025), METI GNT100 2020, TOK Integrated Report 2020, Toray IR materials, ITmedia Business Online (February 2009), Ajinomoto Group ABF, GIGAZINE (April 2026), Nobel Foundation (2019 Chemistry), PwC Japan, NISTEP RM329

  • [Economy] Just 3 in 10 Say They’ve Mastered AI as Job-Loss Fears Spread to Over-40s

    [Economy] Just 3 in 10 Say They’ve Mastered AI as Job-Loss Fears Spread to Over-40s

    Generative AI is everywhere in conversation, yet fewer than 3 in 10 people say they’ve actually mastered using it. According to “Quality of Society Index 2026,” an annual survey released on October 19, 2026 by Dentsu Soken, a large generational gap separates confident AI users from everyone else — and over the past year, anxiety about AI taking people’s jobs has spread beyond young workers to reach people in their 40s, 50s, 60s and 70s as well, narrowing a gap that used to be much wider. Here’s what the numbers show, why the gap between confidence and anxiety matters, and what it suggests about how workplaces should be handling AI training right now.

    原論文情報 / Original Paper
    Title: “Quality of Society Index 2026” (クオリティ・オブ・ソサエティ指標2026)
    Authors: Dentsu Soken Inc., Humanology Innovation Division, Quality of Society Center
    Journal: Dentsu Soken Press Release
    DOI: https://www.dentsusoken.com/news/release/2026/1019.html

    Dentsu Soken’s think-tank arm, the Quality of Society Center, has run this survey every year since 2019 to track how people’s attitudes are reshaping Japanese society — covering everything from views on work and community to broader questions about what a “good society” looks like. The 2026 edition was fielded online from June 23 to 30, 2026, among 12,000 men and women aged 18 to 79 across the country, including high school students, through the research firm Dentsu Macromill Insight. With a sample that large, the margin of error works out to at most ±1.3 percentage points at a 95% confidence level. For the first time since the survey began, this year’s edition added questions about how well people feel they use AI, and how comfortable they are letting AI agents handle everyday tasks on their behalf — a timely addition, given how quickly AI tools have moved from novelty to daily habit for many people over the past two years.

    Confidence in AI Still Lags Behind the Hype

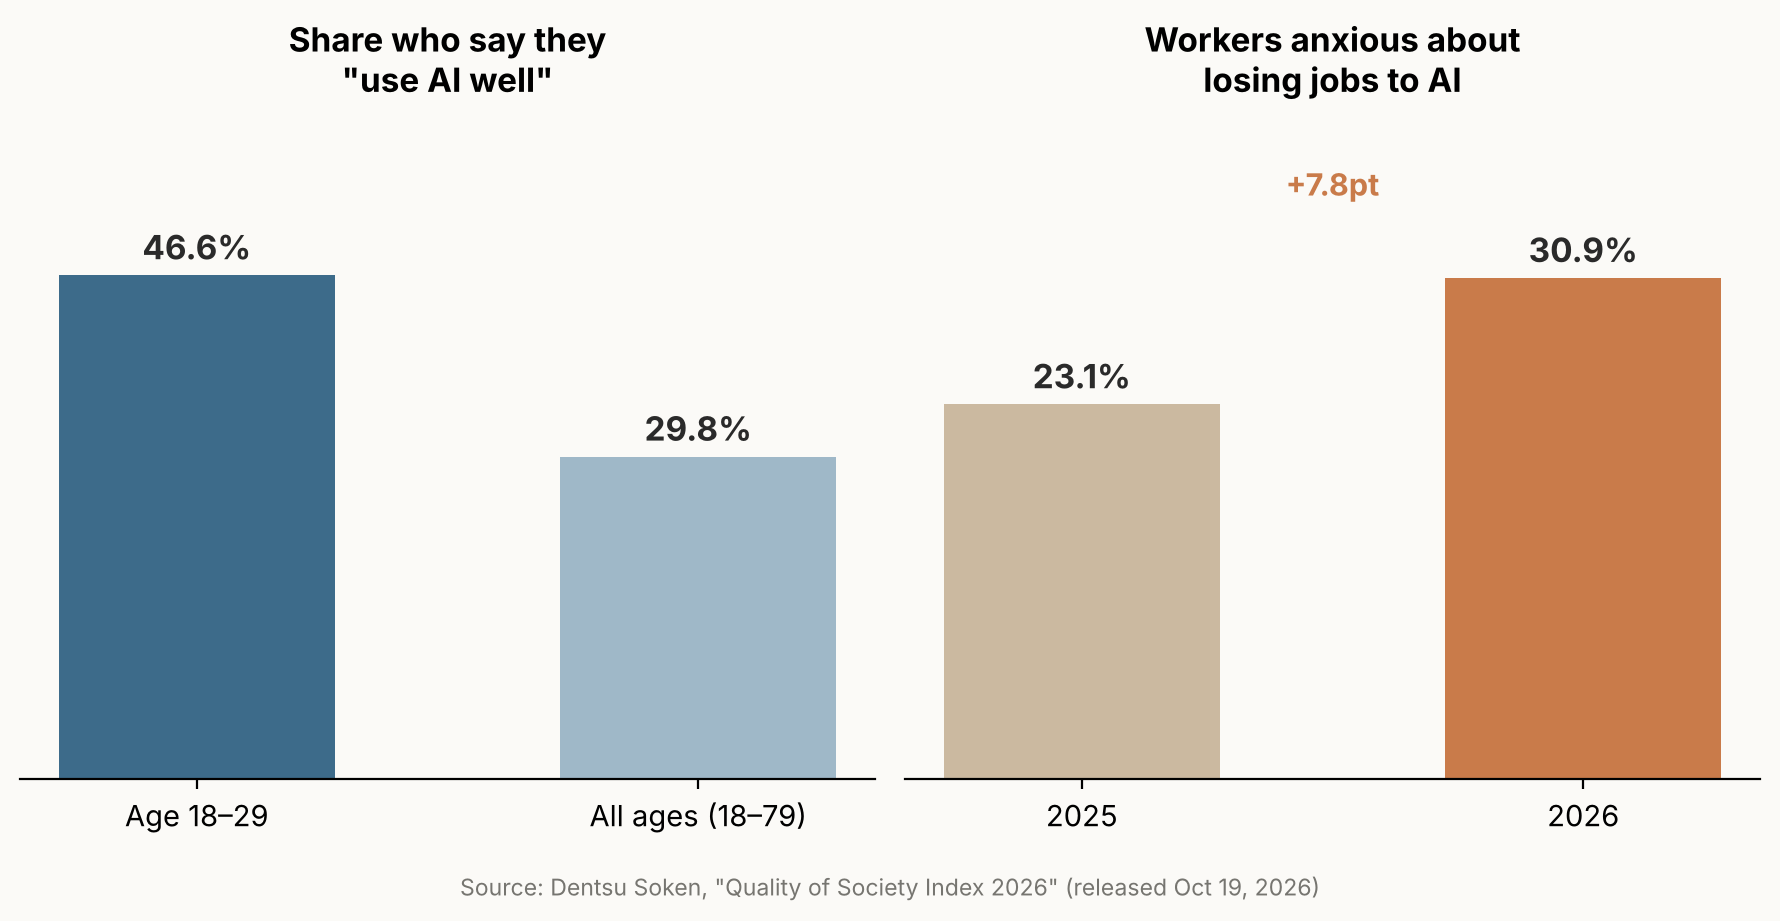
    Asked whether they agreed with the statement “I feel I use AI well,” only 29.8% of respondents said yes. Confidence rose with youth, but even the most confident group — 18-to-29-year-olds — topped out at 46.6%, short of a majority. In other words, even among the demographic that grew up with smartphones and is usually assumed to be most comfortable with new technology, most people still don’t feel they’ve got AI figured out. Dentsu Soken reads this as a sign that while conversational generative AI has become familiar — most people have at least tried a chatbot by now — actually using it well remains a trial-and-error process for the majority. It’s worth being precise about what the 29.8% figure actually measures: it’s self-assessed confidence, gathered by asking people how they feel about their own AI use, not an independent test of how skillfully they actually use it. Someone who rarely uses AI at all and someone who uses it daily but still feels unsure could both end up in the “not confident” category.

    Confident Users Trust AI Agents More

    The survey also asked a more forward-looking question: would people accept letting an AI agent — an automated assistant that acts on a person’s behalf rather than simply answering questions — handle three everyday situations? The scenarios were managing money, such as investment decisions; helping spark a new friendship or romantic connection; and booking restaurants or travel. Across all three, people who said they use AI well were consistently more accepting of handing the task to an AI agent than people who didn’t feel confident. That’s a fairly intuitive result — people who already trust their own ability to work with AI are, unsurprisingly, more willing to extend that trust further — but it’s worth noting precisely what the data can and can’t support. The two measures clearly move together, but a single survey like this can only show that confidence and acceptance are correlated among respondents, not that one causes the other. It’s equally possible that people who are generally early adopters of new technology simply score higher on both measures at once.

    Anxiety Jumps 7.8 Points, Gap Narrows

    Regardless of how confident people felt about using AI themselves, anxiety about losing a job to AI grew across the board. Among currently employed respondents (n=5,734 in 2026, n=5,708 in 2025), 30.9% said they felt anxious about AI or automation taking their job, up 7.8 points from 23.1% the year before — a sizable one-year jump for a tracking survey like this. The shift wasn’t evenly distributed by age, though, and that’s arguably the more interesting part of the finding. A year earlier, anxiety about AI displacing jobs was concentrated among younger workers. In the 2026 wave, that anxiety rose among people in their 40s, 50s, 60s and 70s as well, pulling every age bracket toward roughly 30%, and narrowing what had been a fairly wide generational gap. Dentsu Soken points to a year of expanding AI adoption inside Japanese workplaces as a likely factor behind the broader spread of concern. That’s a reasonable reading of the trend, but it’s the survey organization’s own interpretation of the pattern — this kind of survey can show that anxiety rose and spread across ages, but it can’t, on its own, establish workplace AI adoption as the specific cause.

    30.9% of workers now say they’re anxious about losing their job to AI — up 7.8 points in a year, with the generational gap narrowing as older workers caught up to younger ones.
    Bar charts showing AI confidence by age group and the year-over-year rise in job-loss anxiety
    Source: created from data in Dentsu Soken’s “Quality of Society Index 2026.”

    Echoes of an Earlier AI Persistence Study

    Put the two findings together and a pattern emerges: confidence in actually using AI well remains a minority experience, while anxiety about AI’s effect on jobs has outrun it, spreading across generations faster than comfort with the technology has. That pattern echoes something we covered previously on this site: a set of randomized experiments by researchers at UC Berkeley and several partner institutions, involving 1,222 participants across three separate trials, found that people who leaned on AI assistance to solve math or reading problems performed measurably worse afterward — once the AI was taken away — than people who had worked unaided from the start. In the first experiment, people who had used AI got only 57% of follow-up questions right on their own, versus 73% for the group that never had AI help. It’s important to be precise about what kind of evidence each study offers, though. The Berkeley work was a controlled experiment measuring task performance under lab conditions; the Dentsu Soken survey is a broad measure of public sentiment about jobs and confidence. They’re different kinds of evidence answering different questions, and one doesn’t prove the other. But read side by side, they point toward a broader unease about how people are relating to AI as it becomes more capable and more embedded in daily life and work.

    The Real Risk: A Training Gap

    If AI adoption keeps expanding at work — and the survey’s own data suggests it already has, given how sharply anxiety spread this year — companies will likely need to give employees concrete, hands-on ways to learn how to use AI tools well, along with room to experiment without fear of getting it wrong in front of colleagues or managers. This survey alone can’t say precisely what’s driving the rise in anxiety, or whether workers currently have enough opportunities to build real confidence with these tools. But the combination it does show is hard to ignore: confidence in using AI well remains rare, at well under a third of the population even among the young, while anxiety about AI’s effect on jobs has become common across every age group. That gap points to a practical, near-term challenge for employers: treating AI rollout and workforce training as a single connected problem, rather than assuming that giving people access to AI tools is the same thing as teaching them how to use those tools well.

    Sources: Dentsu Soken, “Quality of Society Index 2026” press release, full survey report (PDF)

  • [Economy] Low Fertility Shows No Clear “Floor,” New Research Finds — What That Could Mean for Japan’s Shrinking Workforce

    [Economy] Low Fertility Shows No Clear “Floor,” New Research Finds — What That Could Mean for Japan’s Shrinking Workforce

    • If low fertility stays lower than some population projections assume, estimates of future workers, taxpayers, and pension contributors may need to be revised — a question that matters for anyone planning decades ahead.
    • Economists analyzed more than 70 years of global fertility data, plus detailed regional records from Japan, the United States, and India.
    • Across every dataset they checked — including all 47 of Japan’s prefectures — the researchers found no clear evidence of a stable, low fertility level at which decline reliably stopped.
    • This is a historical statistical pattern, not a guaranteed future: fertility could still stabilize in particular places, and the researchers themselves stress that this is about the evidence so far, not a prediction.

    A Question Buried Inside Every Population Forecast

    Long-range population projections produced by international organizations and government agencies sometimes build in a particular assumption: in countries where fertility has fallen very low, it will eventually stop declining and roughly stabilize — often somewhere near the “replacement” level, around 2.1 children per woman in a population with today’s typical mortality rates, the rough rate needed to keep a population steady over the long run without migration. Pension systems and long-term corporate planning often lean on projections like these, which is part of why the assumptions behind them matter.

    A new study tests that assumption against the historical record. In a National Bureau of Economic Research (NBER) working paper titled “Does Fertility Stabilize At Low Levels? Evidence from Period, Cohort, and Subnational Data,” economists Diane Coffey, Michael Geruso, Dean Spears, and Sangita Vyas ask a direct question: once fertility drops low, does it actually stop falling anywhere, or does it keep drifting down? Geruso and Spears also present a related analysis in a separate peer-reviewed article in the Journal of Economic Perspectives — a different paper, by two of the four authors, under a different title, rather than a peer-reviewed version of the same NBER study.

    Their conclusion: across the historical data, they found no robust evidence of a fertility level at which decline reliably stops or reverses. That holds globally, and it holds in the three countries — Japan, the United States, and India — where they examined the data region by region.

    Three Countries, One Shared Pattern

    The researchers combined three different kinds of evidence to examine the same question.

    First, they used “period” total fertility rate (TFR) data — a snapshot measure based on the fertility rates observed among women of different ages in a given year — for nearly every country in the world from 1950 to 2023, drawing on United Nations figures. Second, they looked at completed “cohort” fertility — the actual average number of children women in a given birth cohort had over their entire reproductive lives — using records for 31 countries, covering women born between 1935 and 1975. Third, they zoomed into regions within three countries: Japan’s 47 prefectures, individual U.S. states, and 351 districts in India.

    The same pattern showed up at every level. Worldwide, fertility fell from about five children per woman in 1950 to a little above two by 2023, and roughly two-thirds of the world’s population now lives in a country below the replacement level. Across the range of relatively low starting fertility levels in the data — from about 2.3 down to about 1.3 children per woman — the researchers found no point where fertility reliably flattened out afterward.

    In Japan, the median of the 47 prefectures’ fertility rates was 1.53 children per woman in 2015. From that starting point, fertility fell further over the next five years in each of Japan’s 47 prefectures, with no exceptions — not in prefectures that still had comparatively higher rates, and not in the ones that already had Japan’s lowest fertility.

    In U.S. states, the researchers found that, looking at data since 2010, fertility declined on average across every starting fertility level they examined. In India, where fertility is generally higher than in Japan or the U.S., the relationship between a district’s starting fertility and its subsequent change was negative across the entire range of 351 districts studied.

    A Counterintuitive Pattern: Declines Weren’t Slower Near Replacement

    One result stood out. If fertility really did settle near a natural equilibrium close to the replacement level, you might expect fertility sitting right around that level to decline more gently than fertility already well below it — the closer to a “floor,” the gentler the slope should be.

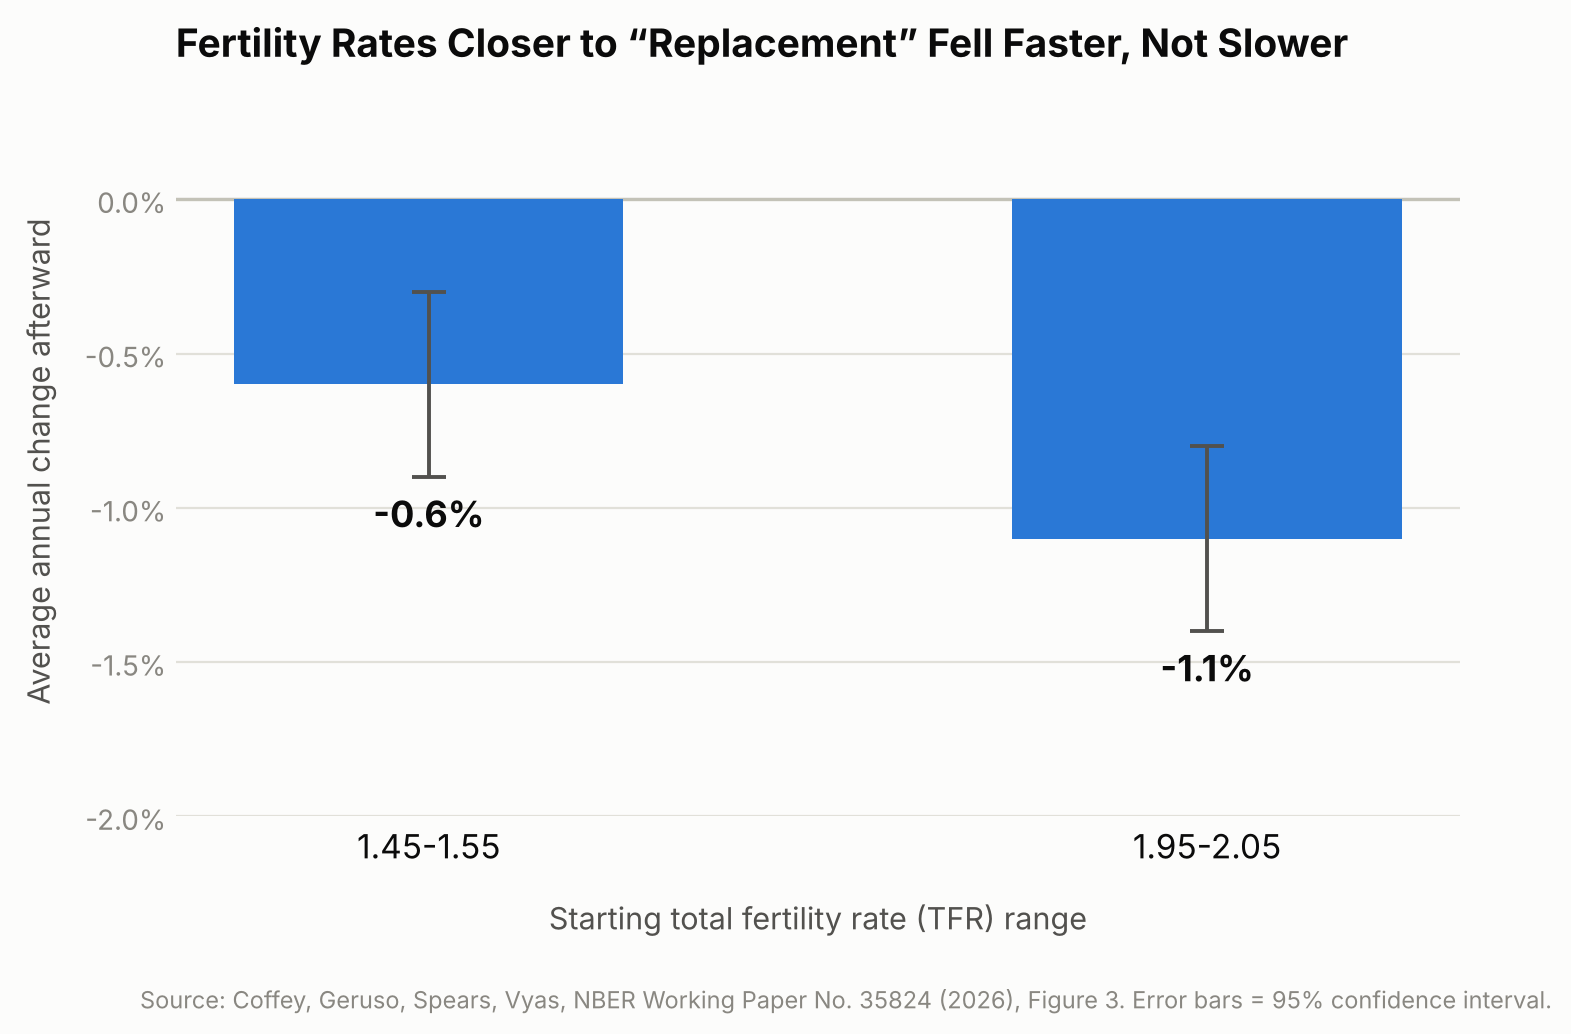
    A pattern where declines slow down as fertility approaches a “floor” did not show up. If anything, the opposite did. Looking at all the country-year observations worldwide from 1950 to 2023, the researchers calculated that fertility rates starting between 1.95 and 2.05 — almost exactly the replacement level — fell by an average of 1.1% per year afterward (a percentage change relative to the starting rate, not a drop of 1.1 children). Rates already lower, between 1.45 and 1.55, fell more slowly, by about 0.6% per year. This is a descriptive pattern in the historical data, not evidence that sitting near replacement fertility itself causes a faster decline; mainly, it argues against replacement level acting as a natural resting point for fertility.

    Bar chart showing fertility rates near replacement level fell faster than lower fertility rates
    Source: Coffey, Geruso, Spears, Vyas, NBER Working Paper No. 35824 (2026), Figure 3.

    Why This Matters Beyond Academic Debate

    This isn’t just an academic curiosity — it bears on economic planning. Pension systems, healthcare budgets, housing demand, and labor-force projections all rest on assumptions about how many future workers and taxpayers a country will have, and some population projections used by international and government agencies build in an assumption that fertility eventually stops falling.

    The study itself doesn’t forecast Japan’s future workforce, pension finances, or infrastructure needs — those depend on many other factors too, including life expectancy, retirement ages, labor-force participation, and migration. But if the historical pattern the researchers identify continues, projections that assume fertility will automatically stabilize may be worth re-examining in light of that pattern, which is relevant anywhere — Japan included — that is already planning for an aging, shrinking working-age population. The authors suggest that standard population projections are best read as conditional scenarios built on chosen assumptions, not as confident predictions of what will actually happen.

    The researchers write: “There is no robust evidence for a systematic fertility rebound, or for a stable equilibrium point at any fertility level conventionally assumed.”

    What This Research Doesn’t Tell Us

    A few limits matter here. First, this is a study of statistical patterns across the past, not a law of nature — it describes what has generally happened, not what must happen everywhere going forward; fertility could still stabilize or even rise in particular places. Second, the authors note that government programs designed to encourage childbirth can shift short-term “period” fertility statistics without necessarily changing how many children women ultimately have over their lifetimes — so a policy might appear to be working in a given year’s data without reversing the longer-run trend. Third, fertility decline and population decline are not the same thing: because of factors like population age structure and migration, a country’s workforce and total population can keep growing for years even after fertility drops below replacement, so the effects described here play out over decades, not immediately.

    Sources: NBER Working Paper No. 35824 (Coffey, Geruso, Spears, Vyas, 2026), Journal of Economic Perspectives, Vol. 40, No. 1 (Geruso & Spears, 2026)

  • [Economy] A ¥20,000 Invention Bonus, a ¥60.4 Billion Court Valuation: How One Patent Built a Trillion-Yen Business

    What if a single patent could translate into a legal claim worth tens of billions of yen for the individual engineer who invented it? Shuji Nakamura, inventor of the blue LED, originally received an in-house bonus of just ¥20,000 for his work — yet a later court case calculated his personal contribution to the invention at roughly ¥60.4 billion. Patents tend to conjure an abstract image, something like a technologist’s badge of honor. But for both companies and the inventors who work for them, a patent is a genuine money-making mechanism. This piece lays out how patents translate into corporate profit, then looks at one real example of a single patent generating extraordinary value: Nichia Corporation’s blue LED patent.

    What a Patent Actually Is

    A patent is a right the government grants to whoever makes a new invention: the exclusive right to use that invention for a set period. In Japan, for 20 years in principle from the filing date, no one but the patent holder may manufacture or sell that invention without permission. In other words, a patent isn’t the technology itself — it’s an asset representing the right to prevent others from using that technology, or to charge them for the privilege, and that right can be bought, sold, and enforced.

    Four Ways Patents Drive Corporate Profit

    High margins through exclusivity (competitors can’t make the same product, so there’s no price competition and margins stay high); license revenue (a company doesn’t have to manufacture anything itself — it can license the technology to others for royalties); litigation and negotiating leverage (a company can seek damages from unauthorized use, or negotiate settlements from a position of strength); and value as an intangible asset (patents held by a company represent enterprise value that doesn’t show up on the balance sheet, but still factors into stock price, fundraising, and M&A valuations). Of these four, exclusivity-driven high margin is by far the most powerful.

    Case Study: How the Blue LED Patent Built a Trillion-Yen Business

    In 1993, Shuji Nakamura, then an engineer at Nichia Corporation, developed the world’s first practical high-brightness blue LED. Until then, LEDs came only in red and green; adding blue completed the three primary colors of light, making full-color displays possible and enabling white LED lighting (created by combining blue with yellow). White LEDs spread around the world as an energy-efficient alternative to incandescent and fluorescent lighting, and Nichia used its blue LED patents to seize an overwhelming share of the global market.

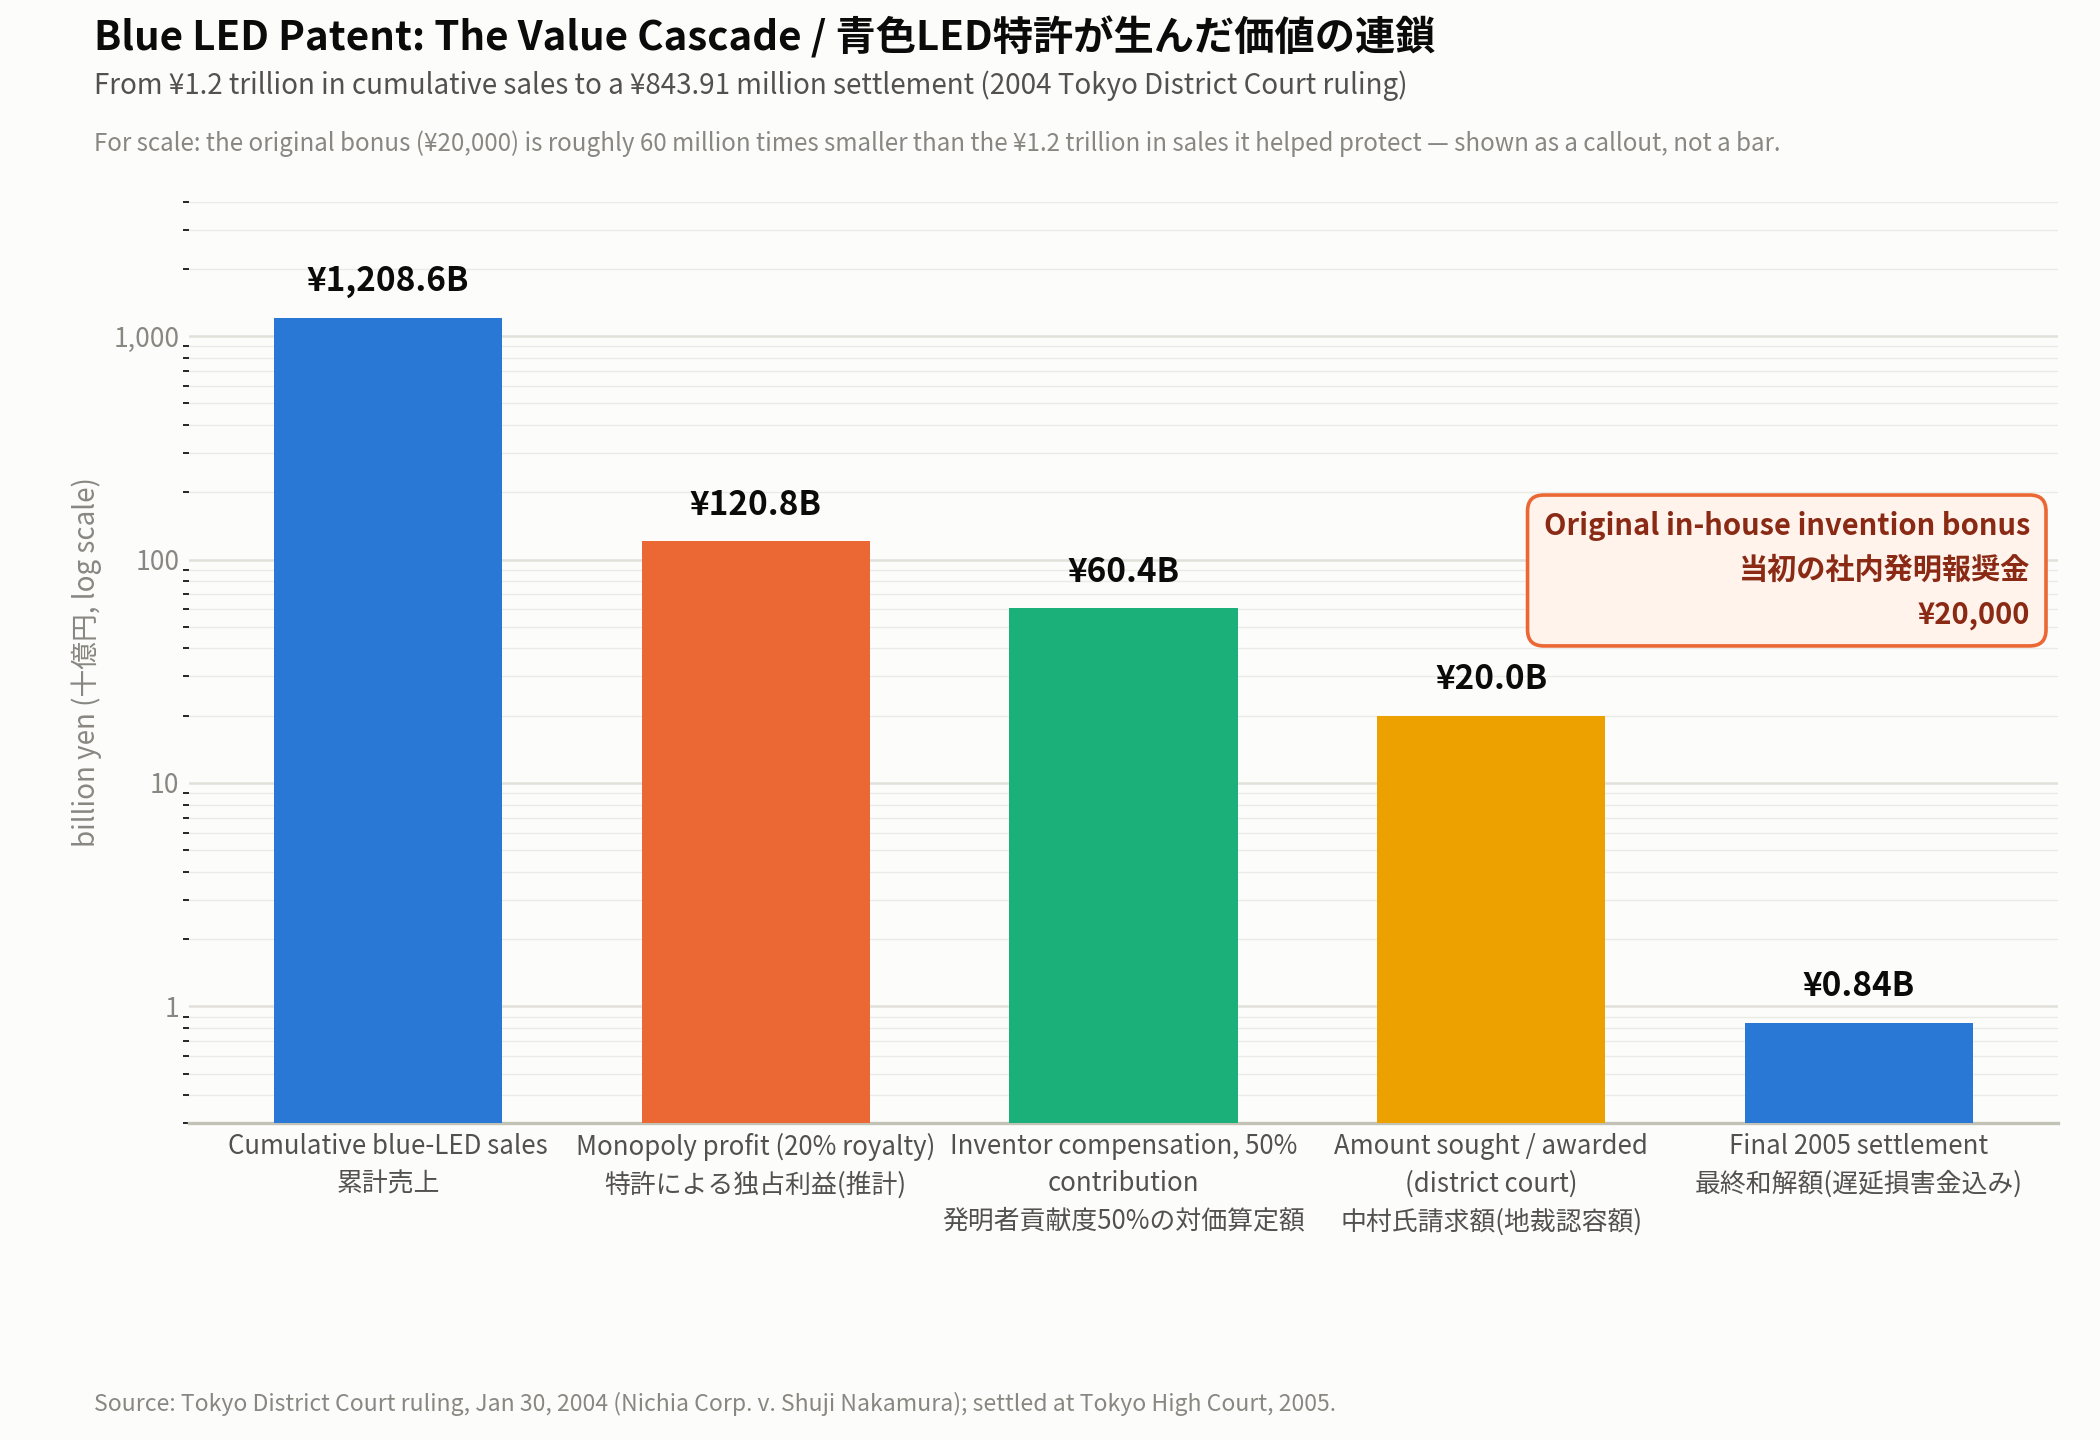
    A 2004 Tokyo District Court ruling put a number on that patent’s worth. Nakamura sued Nichia seeking compensation for his invention under Japan’s employee-invention system, and the court calculated the patent’s value as follows: Nichia’s cumulative blue-LED-related sales came to roughly ¥1.2086 trillion; applying a 20% royalty rate to the portion the patent protected yielded an estimated monopoly profit of roughly ¥120.8 billion; and crediting Nakamura with a 50% contribution to the invention put his compensation at roughly ¥60.4 billion. Of that ¥60.4 billion, the court ordered Nichia to pay the ¥20 billion Nakamura had originally sought. The case was ultimately settled at the Tokyo High Court in 2005, with Nichia paying about ¥843.91 million including delay damages — a steep discount from the district court figure, but still, set against Nakamura’s original in-house invention bonus of just ¥20,000, a striking illustration of how much economic value a single invention and a single patent can carry. In 2014, Nakamura was awarded the Nobel Prize in Physics for the invention.

    Bar chart on a log scale showing the blue LED patent's value cascade: cumulative sales of about ¥1,208.6 billion, an estimated monopoly profit of about ¥120.8 billion, court-calculated inventor compensation of about ¥60.4 billion, the ¥20 billion Nakamura sought, and the final settlement of about ¥843.91 million, with the original ¥20,000 in-house bonus called out separately.
    Figures from the 2004 Tokyo District Court ruling (log scale, billion yen). Note the gap versus the original ¥20,000 in-house bonus. Source: Tokyo District Court ruling, Jan 30, 2004.
    The original in-house invention bonus was ¥20,000. The court’s own calculation of Nakamura’s contribution came to roughly ¥60.4 billion — a gap of about three million times.

    How Japan’s Employee-Invention Rules Changed Afterward

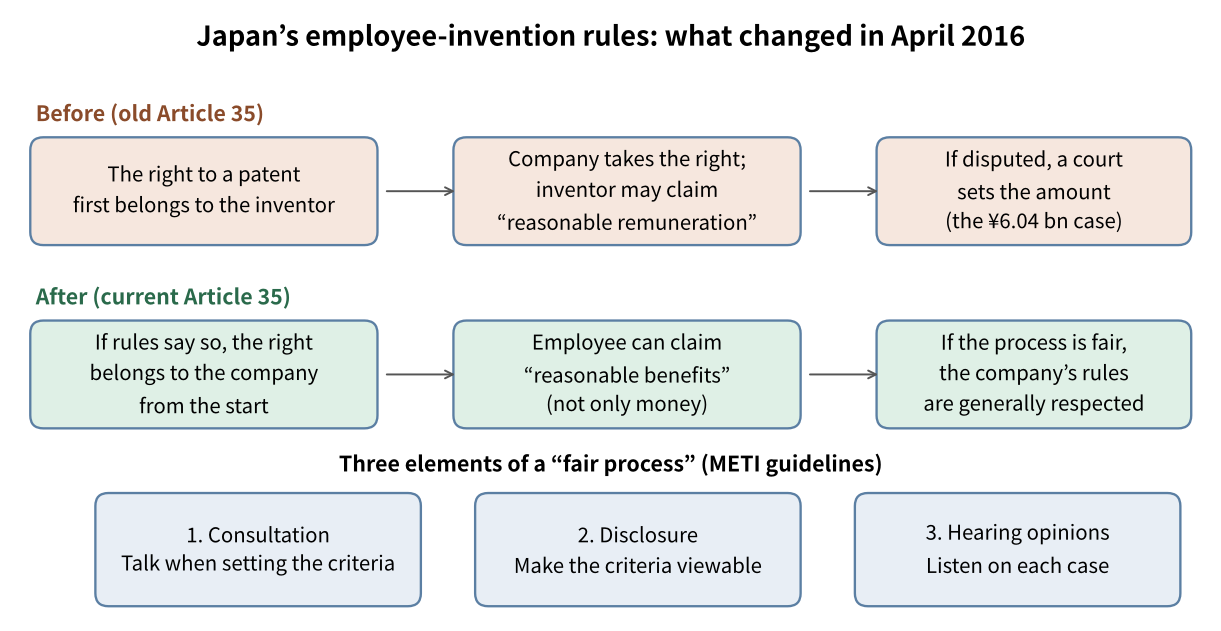
    Employee inventions are governed by Article 35 of Japan’s Patent Act. Under the 2015 amendment (in force from April 1, 2016), if a contract or work rules state in advance that the company acquires the rights, the right to obtain a patent belongs to the company from the moment the invention is made (Article 35, paragraph 3). Before the amendment, the right first belonged to the inventor and the company took it over. The change was meant to remove the complications that arise in joint research and the risk of an inventor assigning the same rights to a third party.

    Employees still keep the right to receive a “reasonable benefit” (paragraph 4). Such a benefit is not limited to money: stock options, promotions, paid leave beyond what the law or work rules require, and study-abroad opportunities can count, but a mere certificate of commendation does not. When a company sets standards for the benefit in a contract or work rules, giving benefits under those standards must not be found unreasonable (paragraph 5). In judging that, the process is taken into account in three steps: consultation when the standards were set, disclosure of the standards, and hearing the employee’s opinion when the benefit for an individual invention is decided. If these steps were handled properly, the company’s standards are respected. The Minister of Economy, Trade and Industry issues guidelines on proper procedure (paragraph 6).

    Five Points to Check in Your Own Company’s Rules

    • Does a contract or the work rules state that the company acquires the rights from the start?
    • Was there an opportunity to consult with employees when the standards for the benefit were set?
    • Are the standards disclosed so that employees can read them, with specific content and conditions?
    • Can employees state opinions or objections when the benefit for an individual invention is decided?
    • If the benefit is not money, is its content specified?

    Inventions made before April 1, 2016 are in principle covered by the old law, and those made on or after that date by the amended law. For a specific case, consult your company’s intellectual property department or a patent attorney or lawyer. This article is general information, not legal advice.

    The Rest of Article 35: Non-Exclusive License and How Benefits Are Valued

    Paragraph 1 provides that even when an employee obtains a patent on an employee invention, the company holds a non-exclusive license to use it free of charge. The idea is that the company provided the research environment and equipment.

    Paragraph 2 makes void any contract or work rule that gives the company advance rights to inventions that are not employee inventions. A company cannot, by rule, automatically own an individual’s invention unrelated to the job.

    Paragraph 7 covers cases in which no standard exists, or in which giving the benefit as the standard provides is found unreasonable under paragraph 5. In that case the content of the reasonable benefit must be decided by considering the profit the company earns from the invention, the burden the company bears in connection with it, the contribution of the company and the inventor, and the treatment of the employee. This is the logic of comparing the value of the invention with each side’s contribution, and it is the idea that comes into play when amounts are disputed.

    Before and after the 2016 amendment of Japan’s employee-invention rules, and the three elements of a fair process
    Before and after the amendment, and the three elements of a “fair process” (diagram by Xsciens based on the JPO overview).

    The Bottom Line

    A patent is a certificate of technical achievement, but it’s also a business asset that feeds directly into company profit through exclusivity, licensing, litigation leverage, and enterprise value. As the blue LED case shows, being first to lock up a genuinely pivotal technology with a patent can be enough, on its own, to build a trillion-yen business — and, as Nakamura’s case shows, can turn a single engineer’s idea into a legal claim worth tens of billions of yen. That’s exactly why companies pour as much energy into patent strategy as they do into R&D itself.

    Xsciens Editorial Note

    The striking “¥20,000 to ¥60.4 billion” figure is real, but the more important story is what happened afterward: the rules themselves changed.

    • A court’s calculation is not money received. As the article notes, the case was settled on appeal for roughly ¥840 million. Remembering only the headline number gives the wrong picture of how the system works.
    • The focus moved from the amount to the process. Under the amendment effective April 2016, if the process (consultation, disclosure and hearing of opinions) is fair, a company’s own rules are generally respected. In principle, that leaves fewer situations in which a court decides the amount afterward.
    • What we still cannot tell. A proper process does not by itself tell us whether the resulting criteria feel fair to employees. That depends on how each company operates.
    • Our imagination (speculation) — We wonder whether, for people who will invent things in the future, reading the company’s invention rules once when joining may matter more than a famous court figure. Knowing the criteria before results appear is likely easier than arguing after them. This is only our speculation, and individual contracts and rules differ widely.

    References for this note: Japan Patent Office, “Overview of the Employee Invention System” (in Japanese; 2015 amendment effective April 2016, “reasonable benefits”, consultation / disclosure / hearing of opinions)

    Tokyo District Court, judgment of January 30, 2004 (the blue LED compensation lawsuit, Nichia Corporation v. Shuji Nakamura)
    ITmedia NEWS, “Blue LED Lawsuit: Nichia Settles for ¥843.91 Million”
    Nichia Corporation, “Settlement in Tokyo High Court Case No. 962 (ne) and No. 2177 of Heisei 16”

  • [Economy] Japan Doesn’t Make the Chips — It Makes the Machines That Make Them, and Leads the World in Patents Too

    The most advanced chips in your phone, your car, and the AI models running in the cloud are usually associated with Taiwan or South Korea — but only a handful of countries can supply the machines that make those chips in the first place. Japan quietly controls this chokepoint in the global semiconductor supply chain, with companies like Tokyo Electron, SCREEN Holdings, and DISCO ranking among the world’s top makers of semiconductor manufacturing equipment. That strength shows up just as clearly in the patent world. Drawing on data from the Japan Patent Office and specialist patent-analytics firms, here’s a look at Japanese equipment makers’ patent trends, what they reveal, and one especially notable patent.

    World-Leading in Both Patent Quantity and Quality

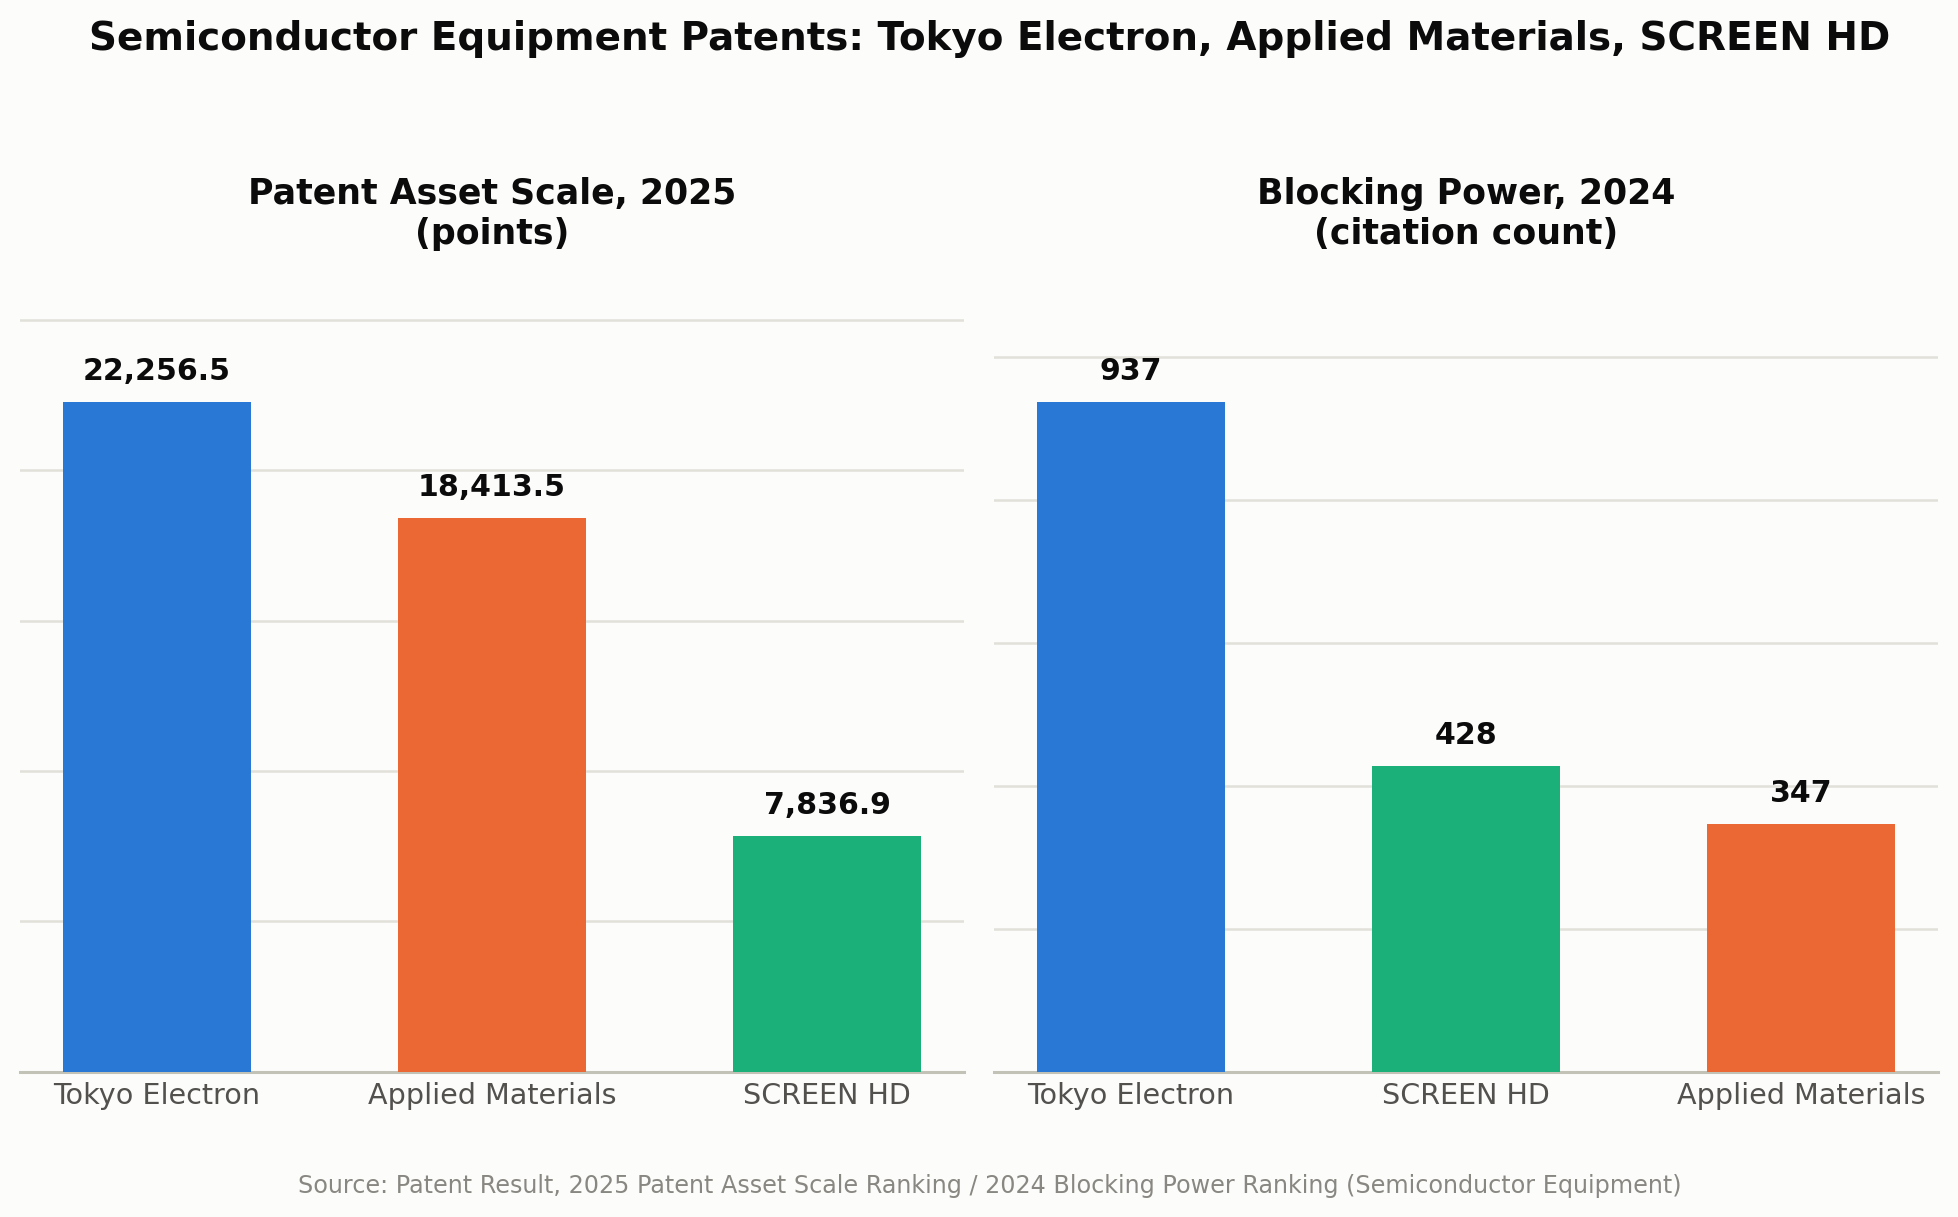
    In the “2025 Patent Asset Scale Ranking for the Semiconductor Equipment Industry,” published by the patent analytics firm Patent Result, Tokyo Electron ranked first in the world with 814 registered patents and a score of 22,256.5 points. Applied Materials of the US came in second (586 patents, 18,413.5 points), and SCREEN Holdings placed third (329 patents, 7,836.9 points). This “patent asset scale” isn’t a simple count of filings — it’s calculated by multiplying each patent’s prominence (such as how often it’s cited) by its remaining term, so it measures not just volume but how many genuinely impactful patents a company holds.

    Even more interesting is the 2024 “Blocking Power Ranking.” This tallies how many times a company’s patents were actually cited by examiners as prior art when rejecting other companies’ applications. Here too, Tokyo Electron topped the list with 937 citations, followed by SCREEN Holdings (428), Applied Materials (347), DISCO (277), and ULVAC (154) — Japanese companies took four of the top five spots. The more often a rival’s new invention gets bounced back with, in effect, “we already patented that,” the more that company’s technology has become foundational to the industry.

    Ranking (Year)1st2nd3rd
    Patent Asset Scale (2025)Tokyo ElectronApplied MaterialsSCREEN HD
    Blocking Power (2024)Tokyo ElectronSCREEN HDApplied Materials
    Bar chart comparing Tokyo Electron, Applied Materials, and SCREEN Holdings on 2025 Patent Asset Scale points and 2024 Blocking Power citation counts
    Source: Patent Result, 2025 Patent Asset Scale Ranking and 2024 Blocking Power Ranking (semiconductor equipment industry)

    Three Things the Patent Data Reveals

    1. Citation counts matter more than filing volume as a measure of real strength.
    In a field like semiconductor equipment, where technology builds cumulatively, foundational inventions with broad applicability tend to get cited again and again as grounds for rejecting later filings. Tokyo Electron topping both rankings isn’t just about filing a lot of patents — it’s evidence the company holds foundational technology that rivals simply can’t route around.

    2. Strength is concentrated in front-end processes (deposition, etching, cleaning).
    Looking at the substance of the top-ranked patents, most cluster around “front-end” technologies that work directly on the wafer — deposition, etching, and cleaning. As chips keep shrinking, the value of nanometer-precision processing and cleaning technology keeps rising, so depth of patents in this area translates directly into competitiveness.

    3. These companies have been filing with a global market in mind from the start.
    According to Tokyo Electron’s own disclosures, the company has maintained a global patent filing rate — the share of patents also filed overseas — of roughly 75% for six consecutive years. Securing rights simultaneously not just in Japan but in the major chipmaking countries and regions (the US, China, South Korea, Taiwan) reflects a filing strategy that tracks the company’s global market share.

    One Standout Patent: A Cleaning-Equipment Patent That’s the Industry’s Biggest “Wall”

    A patent’s value isn’t just about how many there are — it’s also about how much it blocks competitors from filing around it. A good example is Tokyo Electron’s patent covering technology that cleans a wafer’s front surface, its beveled edge (the angled cut at the rim), and its back surface all in a single cleaning tool. According to Patent Result’s 2024 survey, this patent was cited more often than any other as grounds for rejection in competitors’ patent examinations — meaning rival makers’ new cleaning-technology filings have repeatedly run into this one idea.

    Cleaning may sound like an unglamorous step, but a semiconductor becomes defective the moment a single invisible speck of dust lands on it. The idea of efficiently cleaning three differently shaped surfaces — front, back, and edge — in one machine is a foundational technology whose value only grows as miniaturization advances. It’s a good example of an unflashy technology that quietly props up the industry from behind the scenes.

    The Bottom Line

    Behind the flashy headlines about semiconductors themselves, the Japanese companies that build the machines that make them maintain a world-class presence in patents, both in quantity and quality. As demand for AI and leading-edge logic chips keeps growing, the patent competition around front-end technologies like deposition, etching, and cleaning looks set to intensify further.

    Patent Result, “2025 Patent Asset Scale Ranking for the Semiconductor Equipment Industry: Top 3 Are Tokyo Electron, AMAT, and SCREEN”
    Patent Result, “2024 Blocking Power Ranking for the Semiconductor Equipment Industry: Top 3 Are Tokyo Electron, SCREEN, and AMAT”
    Tokyo Electron, “Intellectual Property and Intangible Assets”