Category: Economy

  • [Economy] Just 3 in 10 Say They’ve Mastered AI as Job-Loss Fears Spread to Over-40s

    [Economy] Just 3 in 10 Say They’ve Mastered AI as Job-Loss Fears Spread to Over-40s

    Generative AI is everywhere in conversation, yet fewer than 3 in 10 people say they’ve actually mastered using it. According to “Quality of Society Index 2026,” an annual survey released on October 19, 2026 by Dentsu Soken, a large generational gap separates confident AI users from everyone else — and over the past year, anxiety about AI taking people’s jobs has spread beyond young workers to reach people in their 40s, 50s, 60s and 70s as well, narrowing a gap that used to be much wider. Here’s what the numbers show, why the gap between confidence and anxiety matters, and what it suggests about how workplaces should be handling AI training right now.

    原論文情報 / Original Paper
    Title: “Quality of Society Index 2026” (クオリティ・オブ・ソサエティ指標2026)
    Authors: Dentsu Soken Inc., Humanology Innovation Division, Quality of Society Center
    Journal: Dentsu Soken Press Release
    DOI: https://www.dentsusoken.com/news/release/2026/1019.html

    Dentsu Soken’s think-tank arm, the Quality of Society Center, has run this survey every year since 2019 to track how people’s attitudes are reshaping Japanese society — covering everything from views on work and community to broader questions about what a “good society” looks like. The 2026 edition was fielded online from June 23 to 30, 2026, among 12,000 men and women aged 18 to 79 across the country, including high school students, through the research firm Dentsu Macromill Insight. With a sample that large, the margin of error works out to at most ±1.3 percentage points at a 95% confidence level. For the first time since the survey began, this year’s edition added questions about how well people feel they use AI, and how comfortable they are letting AI agents handle everyday tasks on their behalf — a timely addition, given how quickly AI tools have moved from novelty to daily habit for many people over the past two years.

    Confidence in AI Still Lags Behind the Hype

    Asked whether they agreed with the statement “I feel I use AI well,” only 29.8% of respondents said yes. Confidence rose with youth, but even the most confident group — 18-to-29-year-olds — topped out at 46.6%, short of a majority. In other words, even among the demographic that grew up with smartphones and is usually assumed to be most comfortable with new technology, most people still don’t feel they’ve got AI figured out. Dentsu Soken reads this as a sign that while conversational generative AI has become familiar — most people have at least tried a chatbot by now — actually using it well remains a trial-and-error process for the majority. It’s worth being precise about what the 29.8% figure actually measures: it’s self-assessed confidence, gathered by asking people how they feel about their own AI use, not an independent test of how skillfully they actually use it. Someone who rarely uses AI at all and someone who uses it daily but still feels unsure could both end up in the “not confident” category.

    Confident Users Trust AI Agents More

    The survey also asked a more forward-looking question: would people accept letting an AI agent — an automated assistant that acts on a person’s behalf rather than simply answering questions — handle three everyday situations? The scenarios were managing money, such as investment decisions; helping spark a new friendship or romantic connection; and booking restaurants or travel. Across all three, people who said they use AI well were consistently more accepting of handing the task to an AI agent than people who didn’t feel confident. That’s a fairly intuitive result — people who already trust their own ability to work with AI are, unsurprisingly, more willing to extend that trust further — but it’s worth noting precisely what the data can and can’t support. The two measures clearly move together, but a single survey like this can only show that confidence and acceptance are correlated among respondents, not that one causes the other. It’s equally possible that people who are generally early adopters of new technology simply score higher on both measures at once.

    Anxiety Jumps 7.8 Points, Gap Narrows

    Regardless of how confident people felt about using AI themselves, anxiety about losing a job to AI grew across the board. Among currently employed respondents (n=5,734 in 2026, n=5,708 in 2025), 30.9% said they felt anxious about AI or automation taking their job, up 7.8 points from 23.1% the year before — a sizable one-year jump for a tracking survey like this. The shift wasn’t evenly distributed by age, though, and that’s arguably the more interesting part of the finding. A year earlier, anxiety about AI displacing jobs was concentrated among younger workers. In the 2026 wave, that anxiety rose among people in their 40s, 50s, 60s and 70s as well, pulling every age bracket toward roughly 30%, and narrowing what had been a fairly wide generational gap. Dentsu Soken points to a year of expanding AI adoption inside Japanese workplaces as a likely factor behind the broader spread of concern. That’s a reasonable reading of the trend, but it’s the survey organization’s own interpretation of the pattern — this kind of survey can show that anxiety rose and spread across ages, but it can’t, on its own, establish workplace AI adoption as the specific cause.

    30.9% of workers now say they’re anxious about losing their job to AI — up 7.8 points in a year, with the generational gap narrowing as older workers caught up to younger ones.
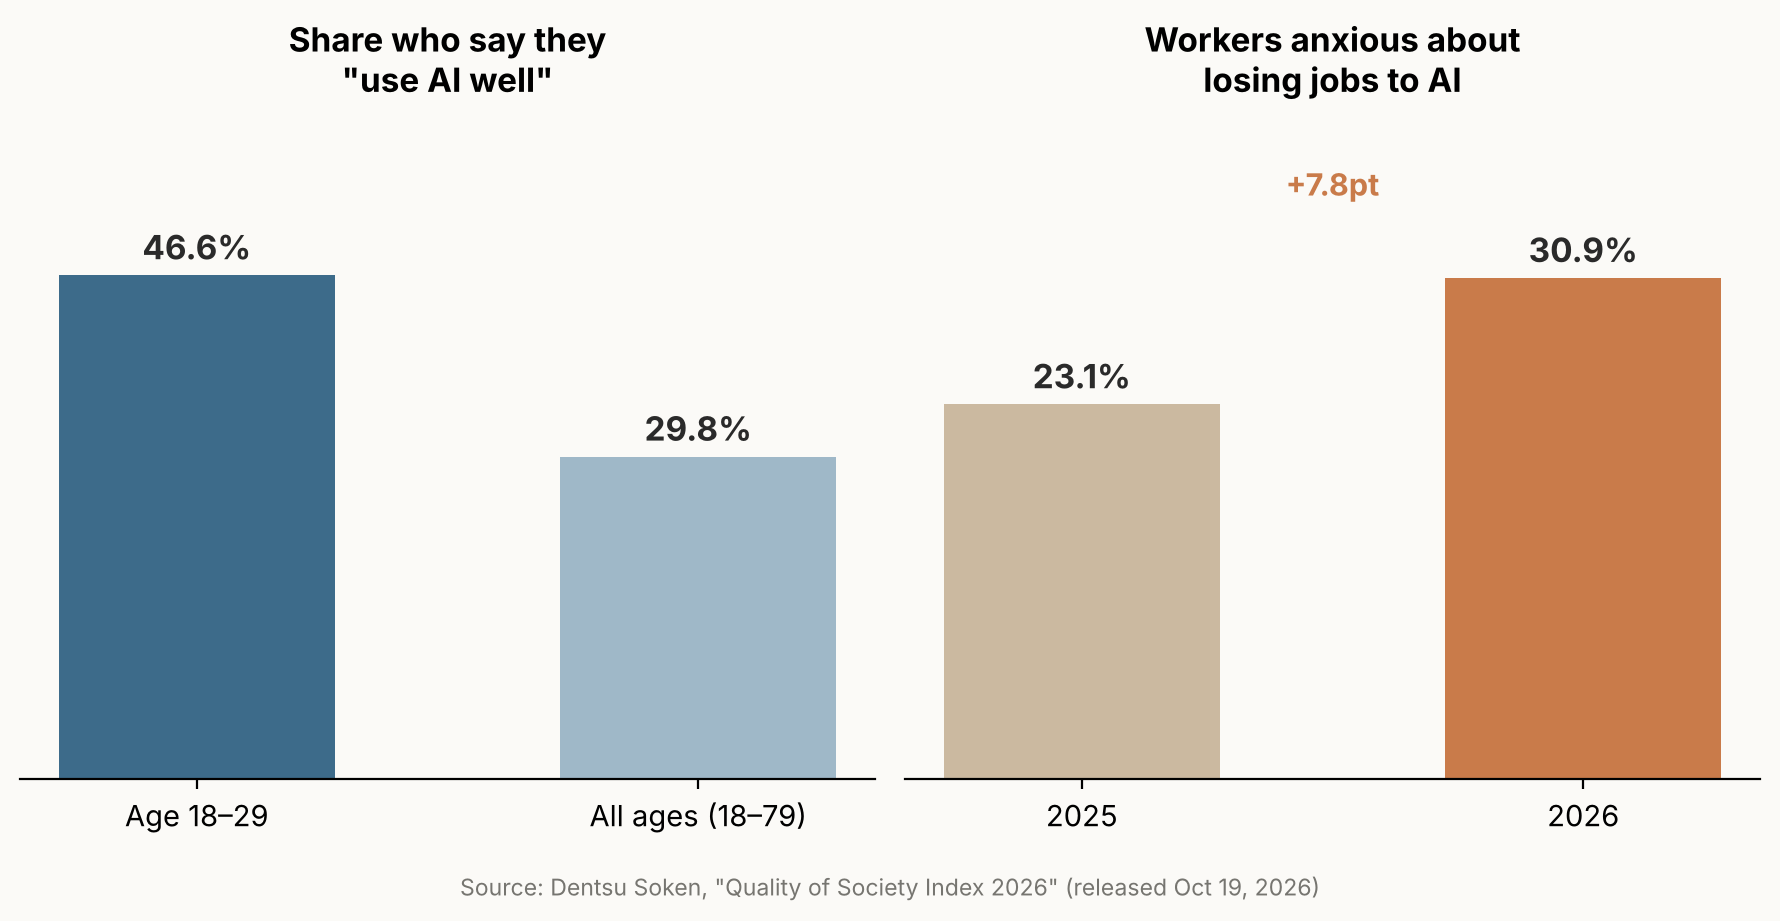
    Bar charts showing AI confidence by age group and the year-over-year rise in job-loss anxiety
    Source: created from data in Dentsu Soken’s “Quality of Society Index 2026.”

    Echoes of an Earlier AI Persistence Study

    Put the two findings together and a pattern emerges: confidence in actually using AI well remains a minority experience, while anxiety about AI’s effect on jobs has outrun it, spreading across generations faster than comfort with the technology has. That pattern echoes something we covered previously on this site: a set of randomized experiments by researchers at UC Berkeley and several partner institutions, involving 1,222 participants across three separate trials, found that people who leaned on AI assistance to solve math or reading problems performed measurably worse afterward — once the AI was taken away — than people who had worked unaided from the start. In the first experiment, people who had used AI got only 57% of follow-up questions right on their own, versus 73% for the group that never had AI help. It’s important to be precise about what kind of evidence each study offers, though. The Berkeley work was a controlled experiment measuring task performance under lab conditions; the Dentsu Soken survey is a broad measure of public sentiment about jobs and confidence. They’re different kinds of evidence answering different questions, and one doesn’t prove the other. But read side by side, they point toward a broader unease about how people are relating to AI as it becomes more capable and more embedded in daily life and work.

    The Real Risk: A Training Gap

    If AI adoption keeps expanding at work — and the survey’s own data suggests it already has, given how sharply anxiety spread this year — companies will likely need to give employees concrete, hands-on ways to learn how to use AI tools well, along with room to experiment without fear of getting it wrong in front of colleagues or managers. This survey alone can’t say precisely what’s driving the rise in anxiety, or whether workers currently have enough opportunities to build real confidence with these tools. But the combination it does show is hard to ignore: confidence in using AI well remains rare, at well under a third of the population even among the young, while anxiety about AI’s effect on jobs has become common across every age group. That gap points to a practical, near-term challenge for employers: treating AI rollout and workforce training as a single connected problem, rather than assuming that giving people access to AI tools is the same thing as teaching them how to use those tools well.

    Sources: Dentsu Soken, “Quality of Society Index 2026” press release, full survey report (PDF)
  • [Economy] The 2026 Economics Nobel — How Expectations Shape Recession Policy

    [Economy] The 2026 Economics Nobel — How Expectations Shape Recession Policy

    On October 12, 2026, the Royal Swedish Academy of Sciences awarded the Nobel Prize in Economic Sciences to Robert E. Hall of Stanford University and Michael Woodford of Columbia University, splitting the 12-million-krona prize between them. Their prize-winning idea sounds abstract — “microeconomic foundations of macroeconomic stabilization” — but it answers a very practical question: why do some recessions drag on for years while others pass quickly, and how can a central bank fight inflation without doing needless damage to jobs and growth? Their work reshaped how major central banks build the models they use to answer that question, giving policymakers a clearer theoretical map of how expectations, not just interest rates, move the economy.

    When 1970s Policy Stopped Working

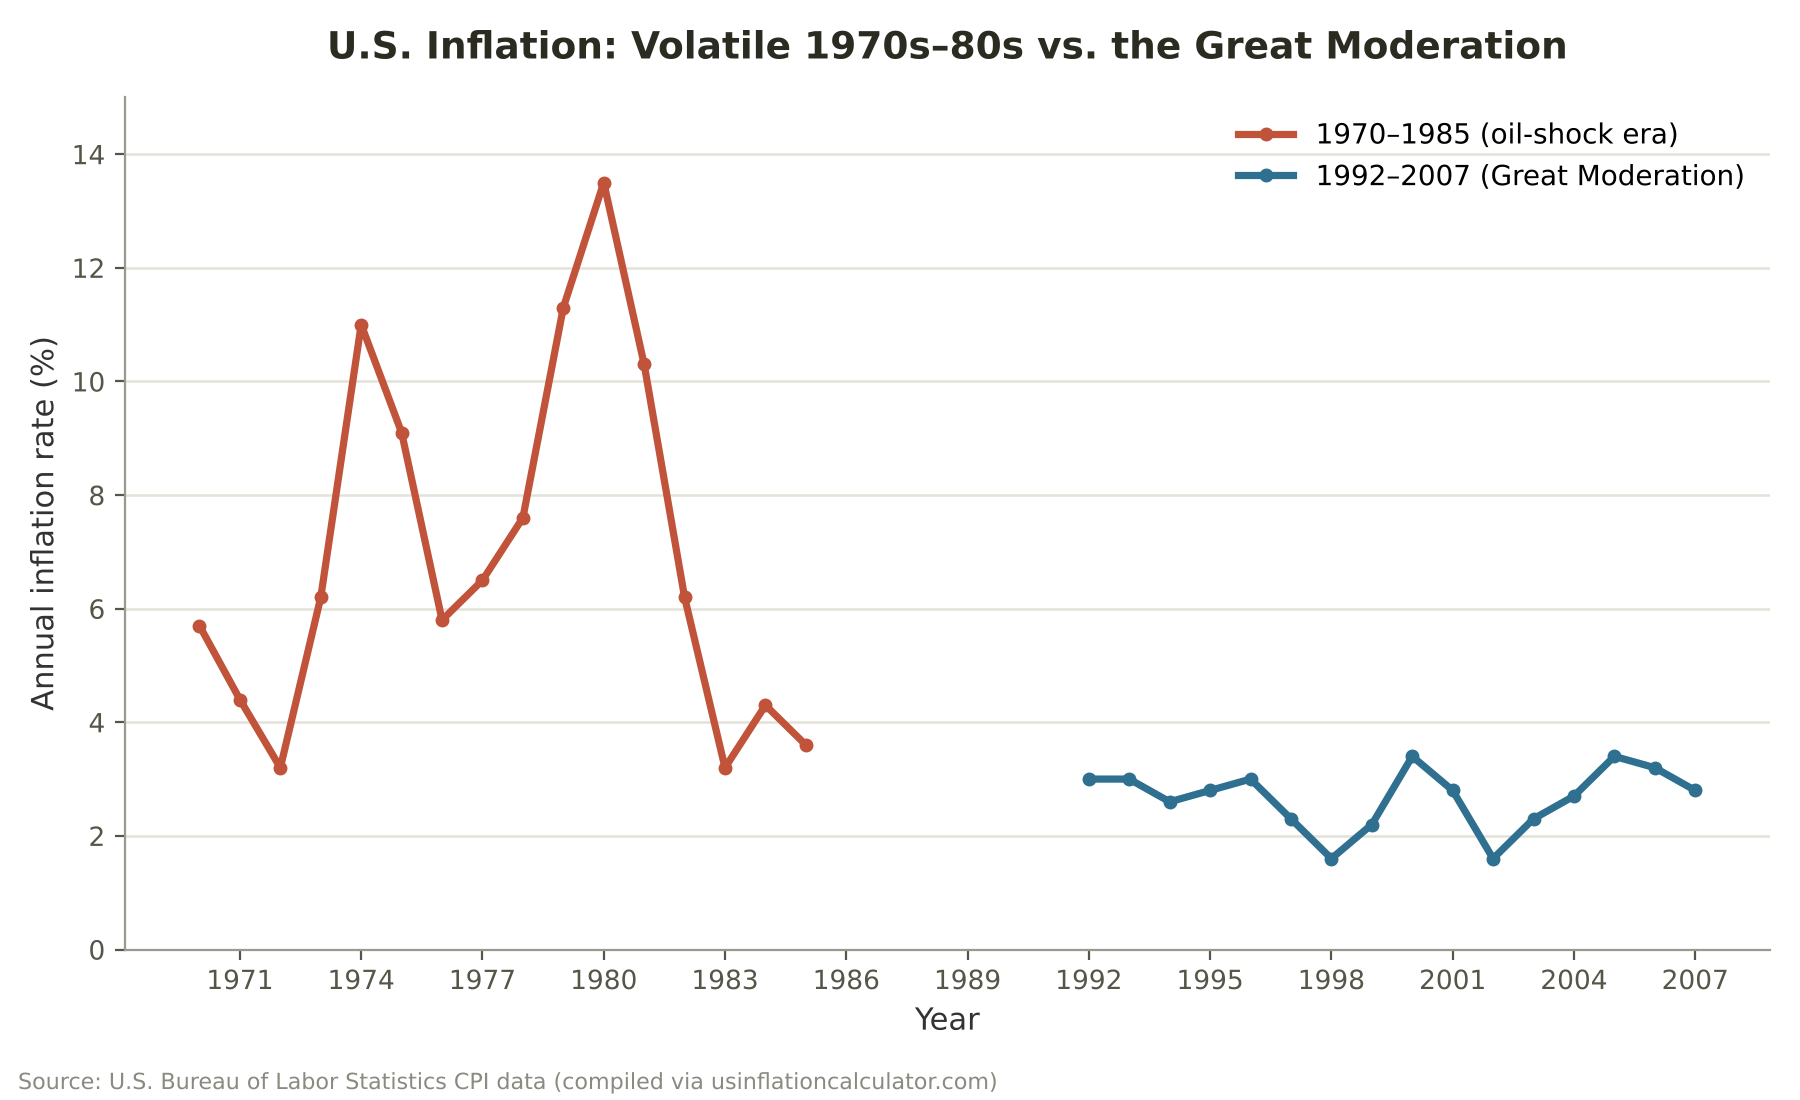
    For decades after World War II, economists leaned on models built from statistical relationships between big aggregate numbers: total output, total employment, the overall price level. Many policymakers treated the link between inflation and unemployment as fairly stable, as if accepting a little more inflation would reliably buy a little less unemployment. The oil shocks of the 1970s strained that assumption badly. U.S. consumer prices rose by roughly 11 percent in 1974, eased briefly, then climbed above 13 percent by 1980, even as unemployment also stayed painfully high. This combination, dubbed “stagflation,” exposed real weaknesses in the prevailing models and forced economists to ask whether their tools for managing the economy were trustworthy at all.

    Starting From How People Decide

    Hall and Woodford, working in a research tradition that also included economists like Julio Rotemberg, pushed macroeconomic theory toward a different starting point: how individual households and firms actually make decisions. In their models, people are forward-looking — workers and firms set wages and prices partly on what they expect will happen next, and households decide how much to save or spend based partly on their expectations about future income and prices. Aggregate outcomes like inflation and employment emerge from how all of those decisions, expectations, and market constraints interact, rather than being assumed directly from past statistical patterns. This approach became a pillar of what economists call New Keynesian models, which combine forward-looking behavior with prices and wages that adjust only gradually, because changing them is itself costly for firms.

    Why Expectations Move Markets

    The forward-looking piece turns out to matter enormously, and it is arguably the most surprising part of the theory for non-economists. If a central bank merely moves interest rates without explaining its reasoning, people may barely change their behavior. But if a central bank credibly signals a future course of action and the public believes it, expectations can shift immediately, often before the policy itself has fully taken effect. Woodford, who has described his own framework as “neo-Wicksellian” after the 19th-century economist Knut Wicksell, argued that how policy is communicated is not a side issue but part of the policy itself. His work helped formalize the theoretical basis for “forward guidance,” in which central banks publicly signal their likely future interest-rate path; the idea existed informally before, but this research gave it a rigorous footing and helped turn it into an explicit, widely used policy tool from the 1990s onward.

    How policy is communicated is not a side issue — it is part of the policy itself.

    From Blackboard to Central Banks

    These ideas did not stay confined to academic journals. Woodford’s 2003 book, “Interest and Prices: Foundations of a Theory of Monetary Policy,” became, in effect, a standard reference for central bank staff economists, and New Keynesian models of the kind he and Hall helped build are now an important part of the analytical toolkit at the U.S. Federal Reserve, the European Central Bank, and other monetary authorities, used alongside other models, data, and judgment to forecast the economy and weigh policy options. Hall’s own career illustrates how closely this research sits next to real-world policymaking: he was the founding chair, from 1978 until 2024, of the committee that is widely treated as the authoritative voice on the official start and end dates of U.S. recessions (Stanford economist Valerie Ramey has chaired it since). Hall is also known for a classic 1978 paper showing that, once people have built their income expectations into their plans, consumption should move roughly like a “random walk” — changing mainly in response to genuinely new information, not drifting along a path that could have been predicted in advance.

    A Calmer Economy, in the Data

    It is hard to credit any single theory alone with calming the economy, and the 2021–2022 inflation surge that followed pandemic-era supply shocks was a reminder that new volatility can still strike. Still, the contrast with the 1970s and early 1980s is notable. Between 1970 and 1985, U.S. annual inflation swung wildly, from about 3 percent in calmer years to a peak above 13 percent during the worst of the oil shocks. For a long stretch of the period economists call the Great Moderation, roughly the mid-1980s through 2007, inflation and output volatility were markedly lower; U.S. annual inflation from 1992 through 2007, for instance, mostly stayed inside a narrow band of roughly 1.6 percent to 3.4 percent. Researchers debate how much credit belongs to better monetary-policy frameworks, including the expectations-focused, microfounded approach Hall and Woodford helped build, versus other factors such as globalization, smaller supply shocks, and improved business inventory management.

    US inflation rate 1970-1985 vs 1992-2007 line chart
    U.S. annual inflation rate: the 1970–85 oil-shock era compared with the 1992–2007 Great Moderation. Source: U.S. Bureau of Labor Statistics CPI data.

    What the Theory Still Can’t Fix

    The framework has clear limits, and the laureates’ own later work points directly at them. The 2008 global financial crisis exposed how little early New Keynesian models accounted for banks, debt, and financial panic, since they mostly assumed credit markets would work smoothly in the background. That gap pushed subsequent research, including work by Woodford, toward incorporating financial frictions and more realistic, limited forms of how people actually process information, an area economists call bounded rationality. Critics also note that leaning heavily on guided expectations can backfire if a central bank’s promises are not believed, which is close to what happened repeatedly through the 1970s. The Nobel committee’s own citation does not claim a finished, universal fix for the business cycle; it credits a stronger theoretical foundation for understanding why stabilization policy works when it works, and why it so visibly failed before.

    The research recognized by this year’s prize did not eliminate the risk of recessions or inflation; shocks, bad data, and public disbelief can still throw policy off course. What it gave policymakers is a sturdier framework for thinking about how expectations and policy choices interact — one more tool for softening the economy’s peaks and troughs, not a guarantee against them.

    Sources: The Royal Swedish Academy of Sciences — Prize in Economic Sciences 2026, Columbia University News, Hall (1978), “Stochastic Implications of the Life Cycle-Permanent Income Hypothesis: Theory and Evidence,” Journal of Political Economy, Woodford (2003), “Interest and Prices: Foundations of a Theory of Monetary Policy,” Princeton University Press

  • [Economy] Low Fertility Shows No Clear “Floor,” New Research Finds — What That Could Mean for Japan’s Shrinking Workforce

    [Economy] Low Fertility Shows No Clear “Floor,” New Research Finds — What That Could Mean for Japan’s Shrinking Workforce

    • If low fertility stays lower than some population projections assume, estimates of future workers, taxpayers, and pension contributors may need to be revised — a question that matters for anyone planning decades ahead.
    • Economists analyzed more than 70 years of global fertility data, plus detailed regional records from Japan, the United States, and India.
    • Across every dataset they checked — including all 47 of Japan’s prefectures — the researchers found no clear evidence of a stable, low fertility level at which decline reliably stopped.
    • This is a historical statistical pattern, not a guaranteed future: fertility could still stabilize in particular places, and the researchers themselves stress that this is about the evidence so far, not a prediction.

    A Question Buried Inside Every Population Forecast

    Long-range population projections produced by international organizations and government agencies sometimes build in a particular assumption: in countries where fertility has fallen very low, it will eventually stop declining and roughly stabilize — often somewhere near the “replacement” level, around 2.1 children per woman in a population with today’s typical mortality rates, the rough rate needed to keep a population steady over the long run without migration. Pension systems and long-term corporate planning often lean on projections like these, which is part of why the assumptions behind them matter.

    A new study tests that assumption against the historical record. In a National Bureau of Economic Research (NBER) working paper titled “Does Fertility Stabilize At Low Levels? Evidence from Period, Cohort, and Subnational Data,” economists Diane Coffey, Michael Geruso, Dean Spears, and Sangita Vyas ask a direct question: once fertility drops low, does it actually stop falling anywhere, or does it keep drifting down? Geruso and Spears also present a related analysis in a separate peer-reviewed article in the Journal of Economic Perspectives — a different paper, by two of the four authors, under a different title, rather than a peer-reviewed version of the same NBER study.

    Their conclusion: across the historical data, they found no robust evidence of a fertility level at which decline reliably stops or reverses. That holds globally, and it holds in the three countries — Japan, the United States, and India — where they examined the data region by region.

    Three Countries, One Shared Pattern

    The researchers combined three different kinds of evidence to examine the same question.

    First, they used “period” total fertility rate (TFR) data — a snapshot measure based on the fertility rates observed among women of different ages in a given year — for nearly every country in the world from 1950 to 2023, drawing on United Nations figures. Second, they looked at completed “cohort” fertility — the actual average number of children women in a given birth cohort had over their entire reproductive lives — using records for 31 countries, covering women born between 1935 and 1975. Third, they zoomed into regions within three countries: Japan’s 47 prefectures, individual U.S. states, and 351 districts in India.

    The same pattern showed up at every level. Worldwide, fertility fell from about five children per woman in 1950 to a little above two by 2023, and roughly two-thirds of the world’s population now lives in a country below the replacement level. Across the range of relatively low starting fertility levels in the data — from about 2.3 down to about 1.3 children per woman — the researchers found no point where fertility reliably flattened out afterward.

    In Japan, the median of the 47 prefectures’ fertility rates was 1.53 children per woman in 2015. From that starting point, fertility fell further over the next five years in each of Japan’s 47 prefectures, with no exceptions — not in prefectures that still had comparatively higher rates, and not in the ones that already had Japan’s lowest fertility.

    In U.S. states, the researchers found that, looking at data since 2010, fertility declined on average across every starting fertility level they examined. In India, where fertility is generally higher than in Japan or the U.S., the relationship between a district’s starting fertility and its subsequent change was negative across the entire range of 351 districts studied.

    A Counterintuitive Pattern: Declines Weren’t Slower Near Replacement

    One result stood out. If fertility really did settle near a natural equilibrium close to the replacement level, you might expect fertility sitting right around that level to decline more gently than fertility already well below it — the closer to a “floor,” the gentler the slope should be.

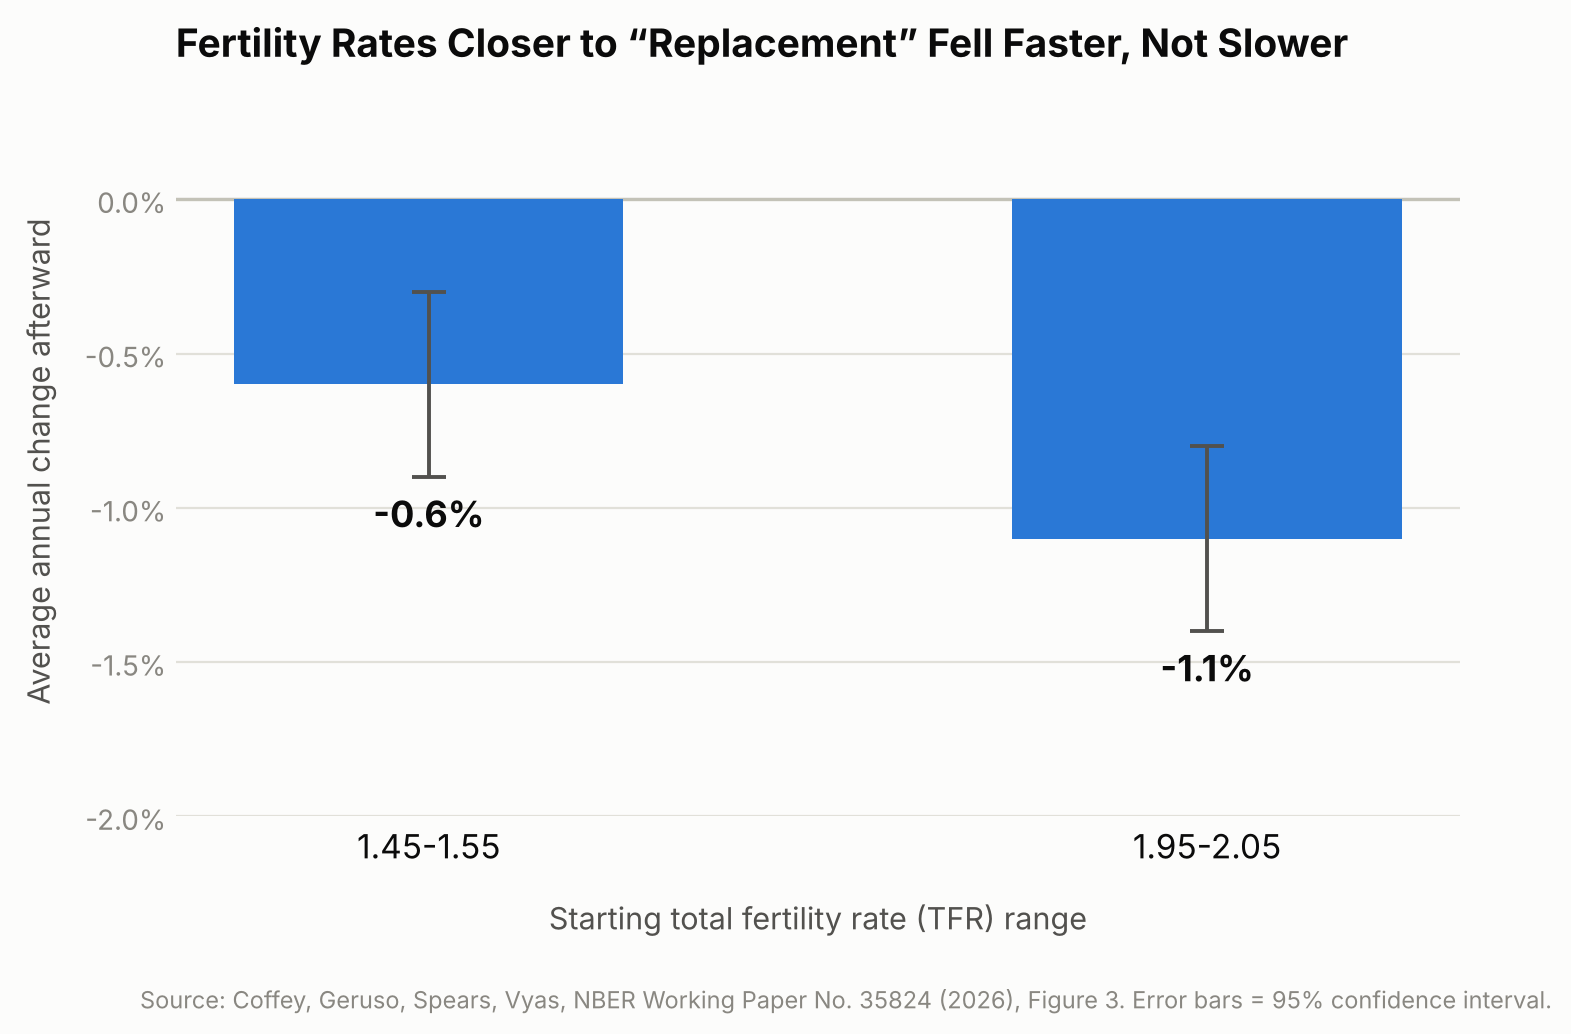
    A pattern where declines slow down as fertility approaches a “floor” did not show up. If anything, the opposite did. Looking at all the country-year observations worldwide from 1950 to 2023, the researchers calculated that fertility rates starting between 1.95 and 2.05 — almost exactly the replacement level — fell by an average of 1.1% per year afterward (a percentage change relative to the starting rate, not a drop of 1.1 children). Rates already lower, between 1.45 and 1.55, fell more slowly, by about 0.6% per year. This is a descriptive pattern in the historical data, not evidence that sitting near replacement fertility itself causes a faster decline; mainly, it argues against replacement level acting as a natural resting point for fertility.

    Bar chart showing fertility rates near replacement level fell faster than lower fertility rates
    Source: Coffey, Geruso, Spears, Vyas, NBER Working Paper No. 35824 (2026), Figure 3.

    Why This Matters Beyond Academic Debate

    This isn’t just an academic curiosity — it bears on economic planning. Pension systems, healthcare budgets, housing demand, and labor-force projections all rest on assumptions about how many future workers and taxpayers a country will have, and some population projections used by international and government agencies build in an assumption that fertility eventually stops falling.

    The study itself doesn’t forecast Japan’s future workforce, pension finances, or infrastructure needs — those depend on many other factors too, including life expectancy, retirement ages, labor-force participation, and migration. But if the historical pattern the researchers identify continues, projections that assume fertility will automatically stabilize may be worth re-examining in light of that pattern, which is relevant anywhere — Japan included — that is already planning for an aging, shrinking working-age population. The authors suggest that standard population projections are best read as conditional scenarios built on chosen assumptions, not as confident predictions of what will actually happen.

    The researchers write: “There is no robust evidence for a systematic fertility rebound, or for a stable equilibrium point at any fertility level conventionally assumed.”

    What This Research Doesn’t Tell Us

    A few limits matter here. First, this is a study of statistical patterns across the past, not a law of nature — it describes what has generally happened, not what must happen everywhere going forward; fertility could still stabilize or even rise in particular places. Second, the authors note that government programs designed to encourage childbirth can shift short-term “period” fertility statistics without necessarily changing how many children women ultimately have over their lifetimes — so a policy might appear to be working in a given year’s data without reversing the longer-run trend. Third, fertility decline and population decline are not the same thing: because of factors like population age structure and migration, a country’s workforce and total population can keep growing for years even after fertility drops below replacement, so the effects described here play out over decades, not immediately.

    Sources: NBER Working Paper No. 35824 (Coffey, Geruso, Spears, Vyas, 2026), Journal of Economic Perspectives, Vol. 40, No. 1 (Geruso & Spears, 2026)