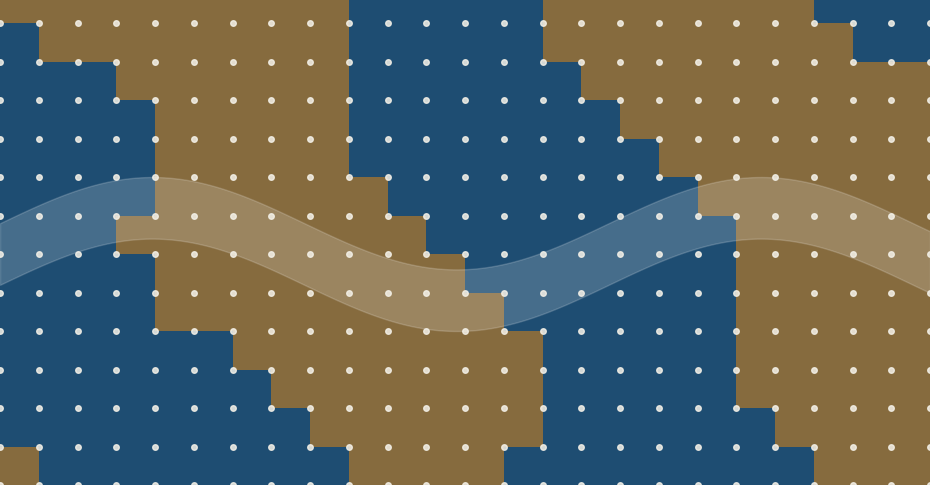
A copper-oxide superconductor that scientists have studied for about 40 years turns out not to be uniform inside. A University of Warwick team used 3D X-ray imaging to show that one well-known crystal is a patchwork of two slightly different atomic arrangements, divided by boundaries roughly 150 nanometres wide. That matters because most theories of these materials quietly assume a uniform crystal, and the hidden boundaries might help explain why seemingly identical samples can perform differently.
Title: Giant Domain Walls and Intrinsic Heterogeneity in 214 Cuprate Superconductors
Authors: Ladbrook, E., Wright, J. P., Senn, M. S.
Journal: Physical Review Letters 137(12), 2026
DOI: 10.1103/r62x-kt5j
What the team found
Copper-oxide superconductors, or cuprates, were discovered in 1986. They carry electricity with zero resistance at temperatures far higher than older superconductors, although still very cold by everyday standards. Four decades on, their behaviour remains only partly understood. Researchers have long known that cuprates can be uneven in their electronic behaviour, but many interpretations have still treated the underlying crystal structure as essentially the same all the way through. How different structural regions are arranged throughout the bulk of a crystal has remained unclear.
The new study, led by Mark Senn at the University of Warwick with Evie Ladbrook and Jon Wright of the European Synchrotron Radiation Facility (ESRF) in France, tested that assumption directly. The sample was a tiny single crystal with the composition La₁.₆₇₅Eu₀.₂Sr₀.₁₂₅CuO₄. It belongs to the “214” family of copper-oxide compounds and is doped to one-eighth, meaning roughly one added charge carrier for every eight copper atoms in its copper-oxide layers, a level at which superconductivity is known to be fragile. Inside it, the researchers found regions with two closely related atomic arrangements, separated by walls far broader than expected.
How you photograph the inside of a crystal
The tool was scanning 3D X-ray diffraction, which works a little like a CT scan. At ESRF’s ID11 beamline, the team focused an X-ray beam to about 120 nanometres and scanned it across the crystal in 50-nanometre steps. The crystal was also rotated so that diffraction data came from many angles, and each scan took about two hours. From the positions of the diffraction spots, the team reconstructed how the crystal lattice is stretched or twisted from place to place, with a strain sensitivity of roughly two parts in ten thousand. Beyond superconductors, the same approach could be used to look for hidden structural variations in other complex materials.
The Warwick press release credits a recent €150 million upgrade of the ESRF for making this kind of measurement practical. In the paper’s own words, the technique offers a general way to resolve the bulk microstructure of materials, not just superconductors.
Walls broader than anyone expected
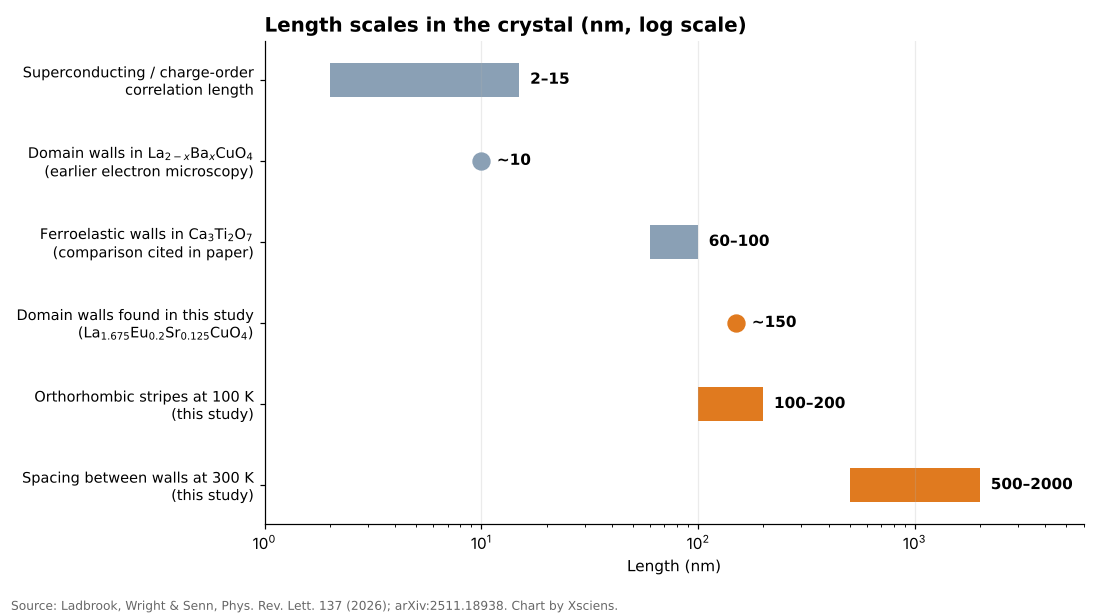
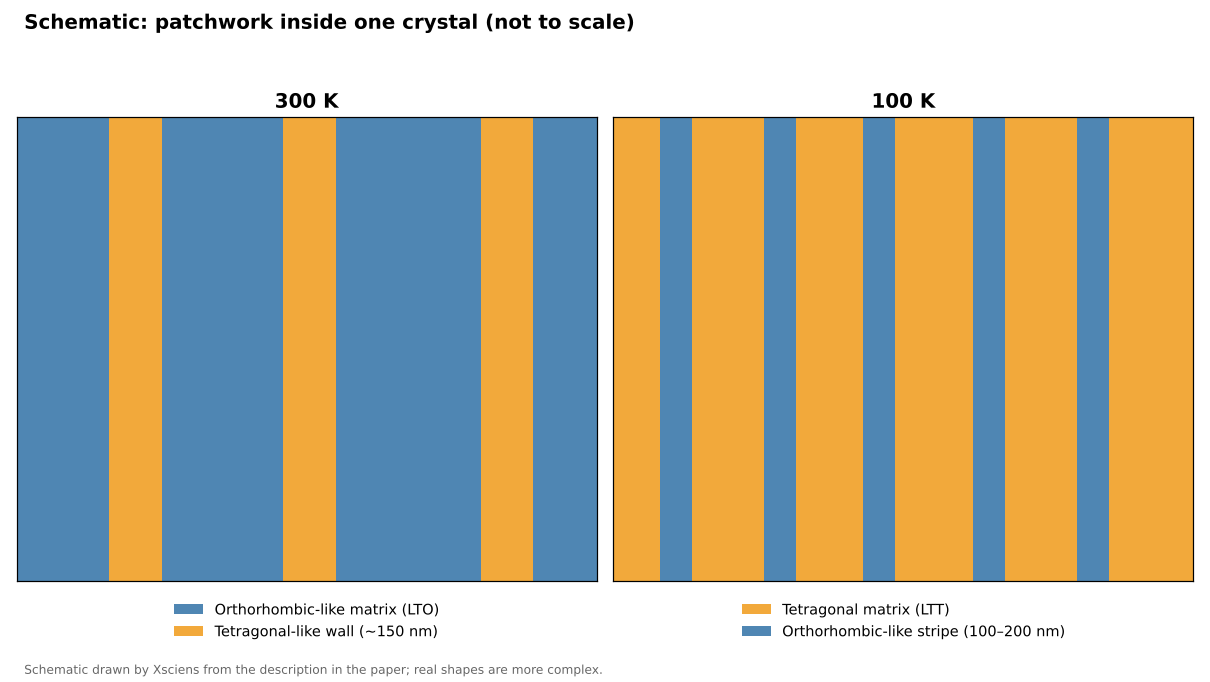
At room temperature (300 K) the crystal is mostly in a so-called orthorhombic state, in which the lattice is slightly stretched along one in-plane direction, with two orientations of twin domains (regions of the same structure rotated relative to each other) each a micron or more across. Between them the team saw wall regions about 150 nanometres thick, spaced roughly 0.5 to 2 micrometres apart, where the measured orthorhombic strain approaches zero. In other words, the walls look more like a different, tetragonal-like structure, one with equal lengths along both in-plane directions, than like thin seams between two orthorhombic domains.
For comparison, earlier electron-microscopy work on a related compound, La₂₋ₓBaₓCuO₄, estimated the width of similar regions at only around 10 nanometres, and the correlation lengths of superconducting and charge-density-wave order in cuprates are typically about 2 to 15 nanometres. (Charge order is a pattern in which electrons gather in regularly repeating regions instead of spreading evenly.) The comparison is rough, since the compounds and techniques differ, but it suggests the new walls are not tiny imperfections: they are broad enough to behave almost like a structure in their own right. Professor Senn said that for forty years the working assumption had been that these materials are the same all the way through.
Cooling reshapes the pattern
The picture changes as the crystal is cooled. This material is known to switch around 160 K from the orthorhombic state to a low-temperature tetragonal one, and the team measured it at 300, 140, 120 and 100 K. At 100 K they saw the reverse arrangement: fine stripes of orthorhombic-like material, each roughly 100 to 200 nanometres wide, embedded in a tetragonal matrix. So the pattern does not simply become more uniform on cooling; the dominant structure changes while smaller regions of the other one remain embedded in it. Earlier studies have reported that this kind of coexistence persists down to at least 10 K in this material and a related barium compound, but the new X-ray measurements went no lower than 100 K.
Why it matters, and what is not yet shown
The idea that structure and superconductivity interact in this family is not new. In 1995, a neutron-scattering study on a related compound near one-eighth doping linked a static pattern of alternating spin and charge stripes to the suppression of superconductivity there. What the Warwick work adds is a three-dimensional, micrometre-scale view of how the crystal structure itself is divided up, and the finding that the dividing walls are much wider than the sharp seams people tended to picture.
The authors suggest the tetragonal-like boundaries could influence the competition between superconductivity and charge order, and Professor Senn says they probably work against superconductivity rather than alongside it. If so, that could help explain why some cuprates outperform others and why bulk measurements sometimes disagree. Understanding why some cuprates superconduct better than others has been a longstanding challenge, so the way structural regions are arranged may be one more factor to consider alongside chemical composition. The authors also expect similar patchwork in the wider 214 family, and possibly in related materials studied under extreme pressure. If so, some past bulk measurements may need reinterpreting.
Those are hypotheses, not results. The experiment measured crystal structure, not electrical behaviour: superconductivity at the walls was not measured directly, and the paper describes the link as suggestive. Only one micro-crystal was measured, the apparent wall width depends on the instrument’s resolution, and the faint charge-order signals cannot yet be mapped with this method.
Xsciens Editorial Note
One carefully imaged crystal shows that the “same all the way through” assumption fails in at least one well-studied cuprate.
- What was observed versus what was inferred. The observation is a three-dimensional map of structural distortion: tetragonal-like walls about 150 nm thick at 300 K and orthorhombic-like stripes in a tetragonal matrix at 100 K. That the walls suppress superconductivity is an interpretation, not a direct measurement, and the paper calls the evidence suggestive.
- The sample is tiny and single. The result comes from one crystal about 15 × 20 × 20 micrometres of one composition. The authors state that extending it to other cuprates is a prediction, and measured wall widths depend on the instrument’s resolution (roughly 30–70 nm).
- What to watch next. The key test is whether superconductivity is weaker inside the walls themselves or whether the walls affect the surrounding crystal. That needs structural imaging combined with local electrical measurements, including charge order, repeated on other cuprates.
- From the editors — superconductors that are easier to make and work better could one day mean leaner power grids and smaller, cheaper MRI scanners in more hospitals. The route there may run through treating the arrangement of a crystal’s internal regions as a design dial, alongside its chemical recipe, although removing every wall might not even help. But a tidy lab crystal is a long way from an affordable wire. So when a superconductor headline promises a revolution, ask how large the sample was and what was actually measured.
References for this note: Keimer et al., “From quantum matter to high-temperature superconductivity in copper oxides,” Nature (2015), Tranquada et al., “Evidence for stripe correlations of spins and holes in copper oxide superconductors,” Nature (1995)
Sources: University of Warwick press release, Physical Review Letters (DOI 10.1103/r62x-kt5j), arXiv:2511.18938