- Almost all of the extra heat trapped by human-caused warming ends up in the ocean, so how well we can measure that heat shapes how much we can trust climate tracking and forecasts of rising seas.
- German researchers built a new way to estimate that heat, combining data from floating ocean sensors and two kinds of satellites to recalibrate the computer reconstructions scientists normally rely on.
- For part of the past two decades, one widely used reconstruction estimated far more ocean heat uptake than the new study did — in one stretch, nearly double.
- The heat also hasn’t spread evenly: the Indian Ocean absorbed an outsized share between 2005 and 2015, a pattern that has since become more evenly spread across the Pacific, Indian, and Atlantic Oceans.
Why the Ocean’s Heat Bill Matters
Earth is currently taking in more heat from the sun than it radiates back out to space, mainly because greenhouse gases trap extra energy near the surface. Almost all of that surplus heat — roughly 90%, according to the new study — ends up in the ocean rather than in the air or on land. By absorbing so much of that excess energy, the ocean slows down how fast the atmosphere and land surface heat up, which is a large part of why it’s one of the most closely watched numbers in climate science.
Scientists actually track two related but different numbers here: ocean heat content, meaning how much extra heat is already stored in the ocean, and ocean heat uptake, meaning how fast the ocean is gaining more of it, usually measured in watts per square meter of ocean surface. This story is mostly about the second number — the uptake rate, and how it differs from one ocean region to the next. As seawater heats up, it also expands slightly, a process called thermal expansion (think of a thermometer, where the liquid rises in the tube as it warms and takes up more space). That expansion drives a significant share of global sea-level rise.
Getting a precise number for how fast the ocean is taking up heat, and where, turns out to be surprisingly hard. Researchers at the University of Bonn in Germany, in a study published in October 2026 in the journal Earth System Science Data, set out to make that accounting more reliable — and to see how it compares with the estimates climate scientists currently rely on.
Three Data Sources, One Recalibrated Picture
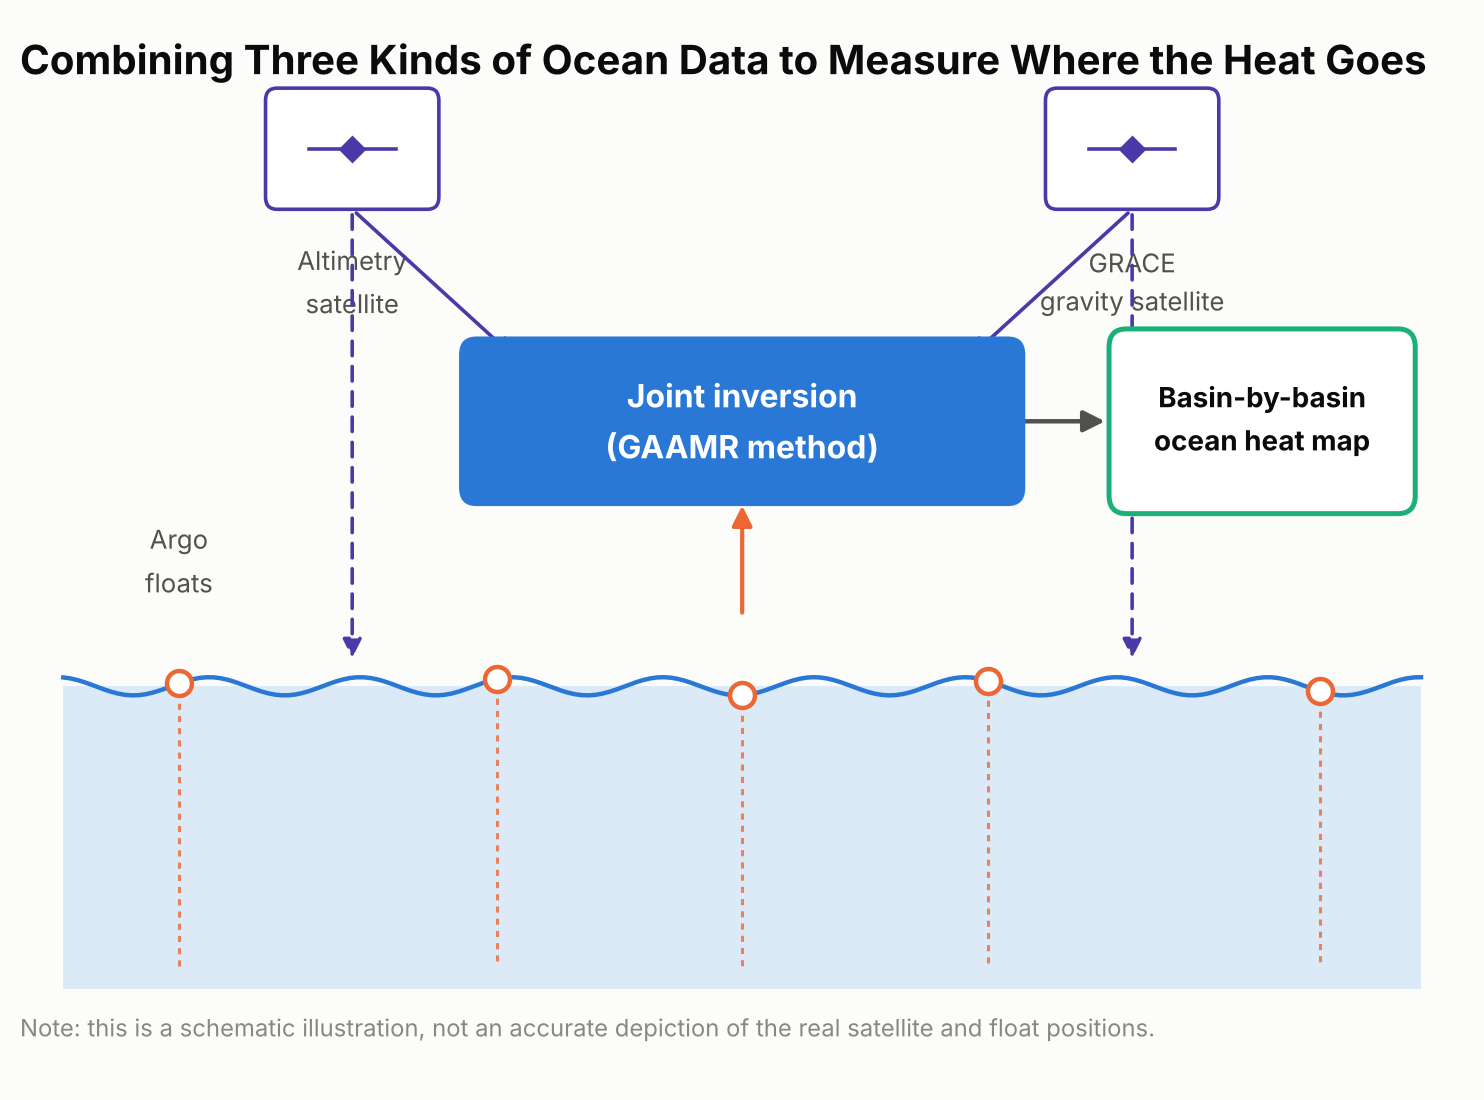
No one can scoop up the ocean and measure its heat directly. Scientists instead combine indirect clues, and each one has blind spots on its own. The Bonn team’s new approach, which they call GAAMR (Grace, Altimetry and Argo Mode Rescaling), draws on three streams of satellite and ocean data: two satellite-based measurements and one array of ocean-going floats.
The first is a global fleet of thousands of drifting robotic sensors called Argo floats, which sink and rise through the upper two kilometers of the ocean roughly every ten days, recording temperature and salinity as they go; Argo samples the upper ocean far more densely than the deep ocean, so deeper water is handled differently, as explained below. The second is satellite radar altimetry, which tracks the height of the sea surface from orbit; averaged over time, it can measure global sea-level trends to within a couple of millimeters a year, and warmer water takes up more space, so part of that rise reflects ocean expansion. The third is data from GRACE, a pair of satellites that detect tiny shifts in Earth’s gravity field caused by moving mass on and near the surface, including ice sheets, glaciers, and water stored on land. That gravity data helps researchers separate the part of sea-level rise caused by this extra mass from the part caused by the ocean simply expanding as it warms.
Importantly, the new method isn’t a model-free measurement. It still starts from an ocean model — the same ORAS5 reanalysis used for comparison below — to map out the likely regional patterns of warming. What’s different is that, rather than trusting those modeled patterns at face value or applying one global adjustment factor to the whole ocean, the researchers rescale the patterns region by region using the real satellite and float observations. That regional rescaling, instead of a single worldwide correction, is the method’s main innovation, and it produces monthly, region-by-region estimates of ocean heat uptake rather than one rough global figure.
What the New Numbers Show
Added up across the whole ocean, the new approach lines up reasonably well with several other independent estimates: it puts global ocean heat uptake from 2005 through 2024 at 0.62 watts per square meter, averaged over every patch of ocean surface on Earth. That figure is broadly consistent with estimates built from the Argo float network alone and with NASA’s CERES satellite measurements of Earth’s energy budget.
Where the new estimate diverges is in comparison with ORAS5 specifically — a widely used “ocean reanalysis,” meaning a computer reconstruction that blends an ocean circulation model with whatever real-world observations are available, rather than a forward-looking climate projection. Over 2005–2024, ORAS5 put global ocean heat uptake at about 0.82 watts per square meter, roughly a third higher than the new study’s figure. The gap was much larger for the first half of that period.
For 2005 to 2015, ORAS5 estimated ocean heat uptake at 1.09 watts per square meter, compared with 0.58 watts per square meter from the new GAAMR reconstruction — almost double.
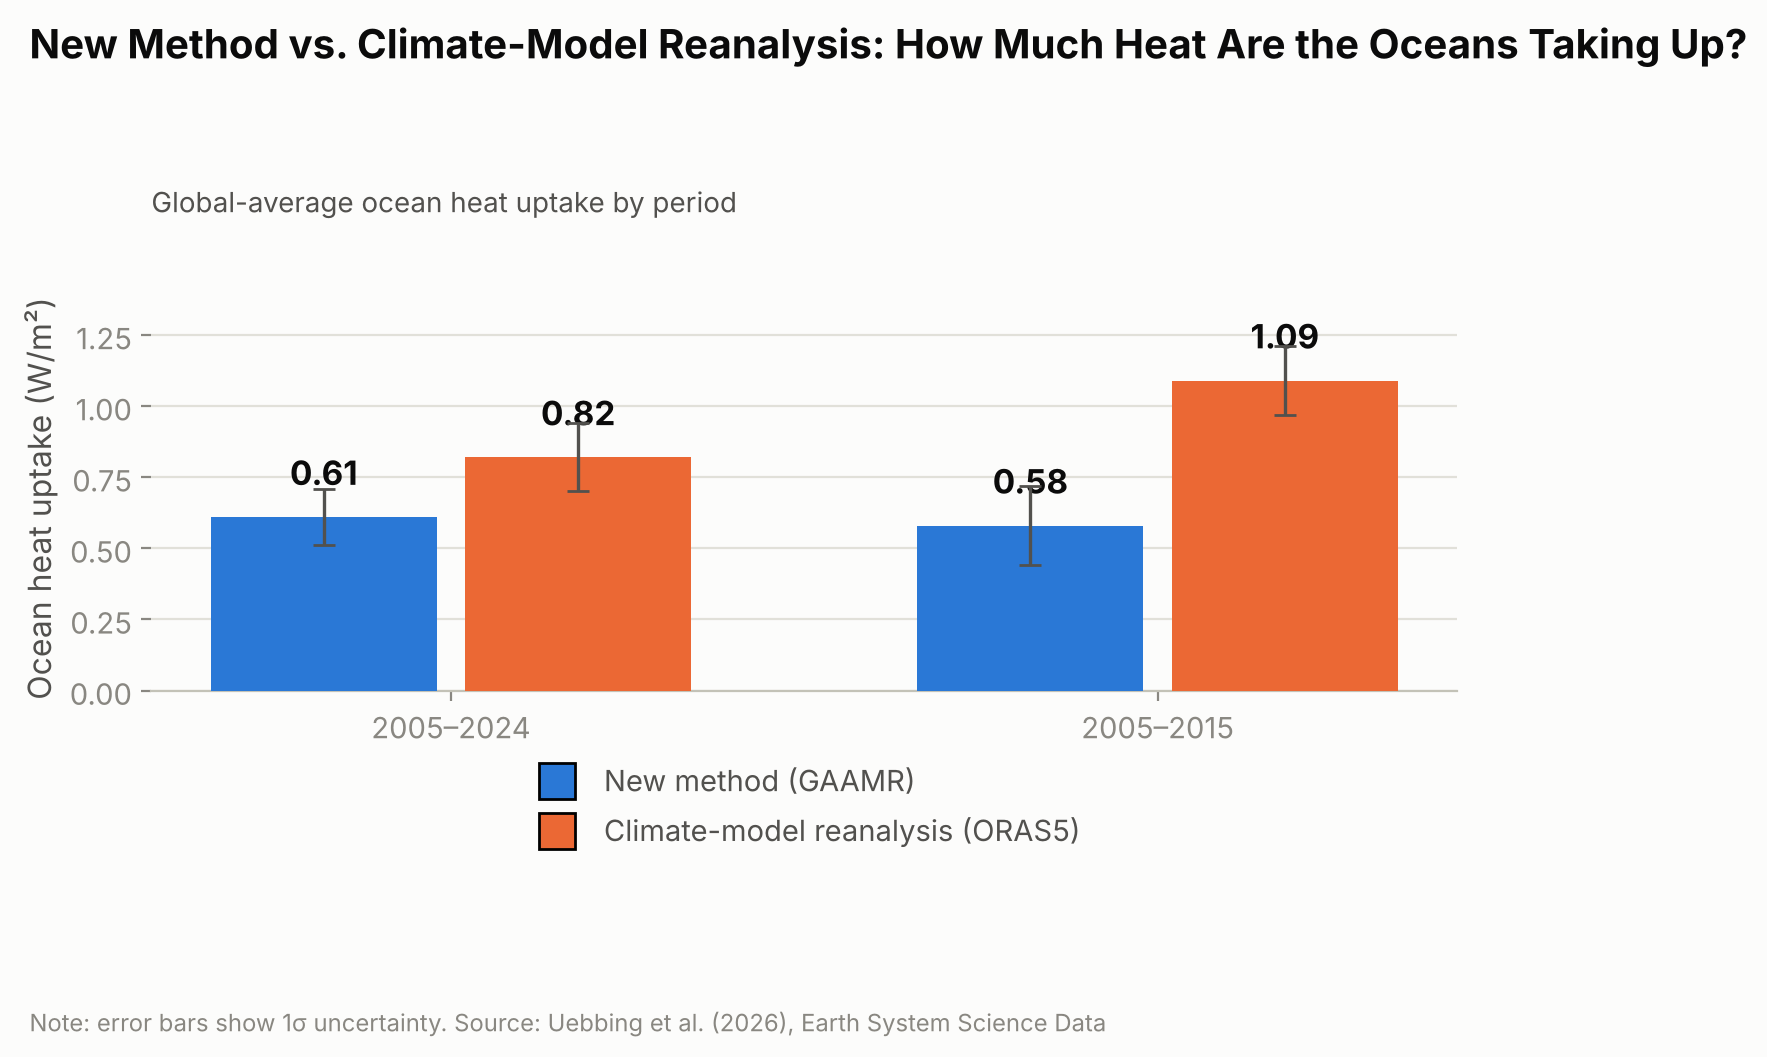
The researchers are careful not to frame this as proof that climate models in general overstate ocean warming. Their own result broadly agrees with several independent observational estimates; the clearer gap is specifically with ORAS5, suggesting that particular reanalysis may be overstating how fast the ocean has taken up heat, especially during the 2005–2015 decade.
Heat on the Move: Why Some Ocean Basins Differ
The new regional estimates also reveal something a single global number can’t: heat hasn’t been spreading evenly across the world’s oceans. Over the full 2005–2024 period, the Pacific, Indian, and Atlantic Oceans together accounted for the large majority of the extra heat, with the Pacific absorbing the most, followed closely by the Indian Ocean and then the Atlantic. The Southern Ocean and Arctic Ocean, despite their size, contributed only a few percent combined.
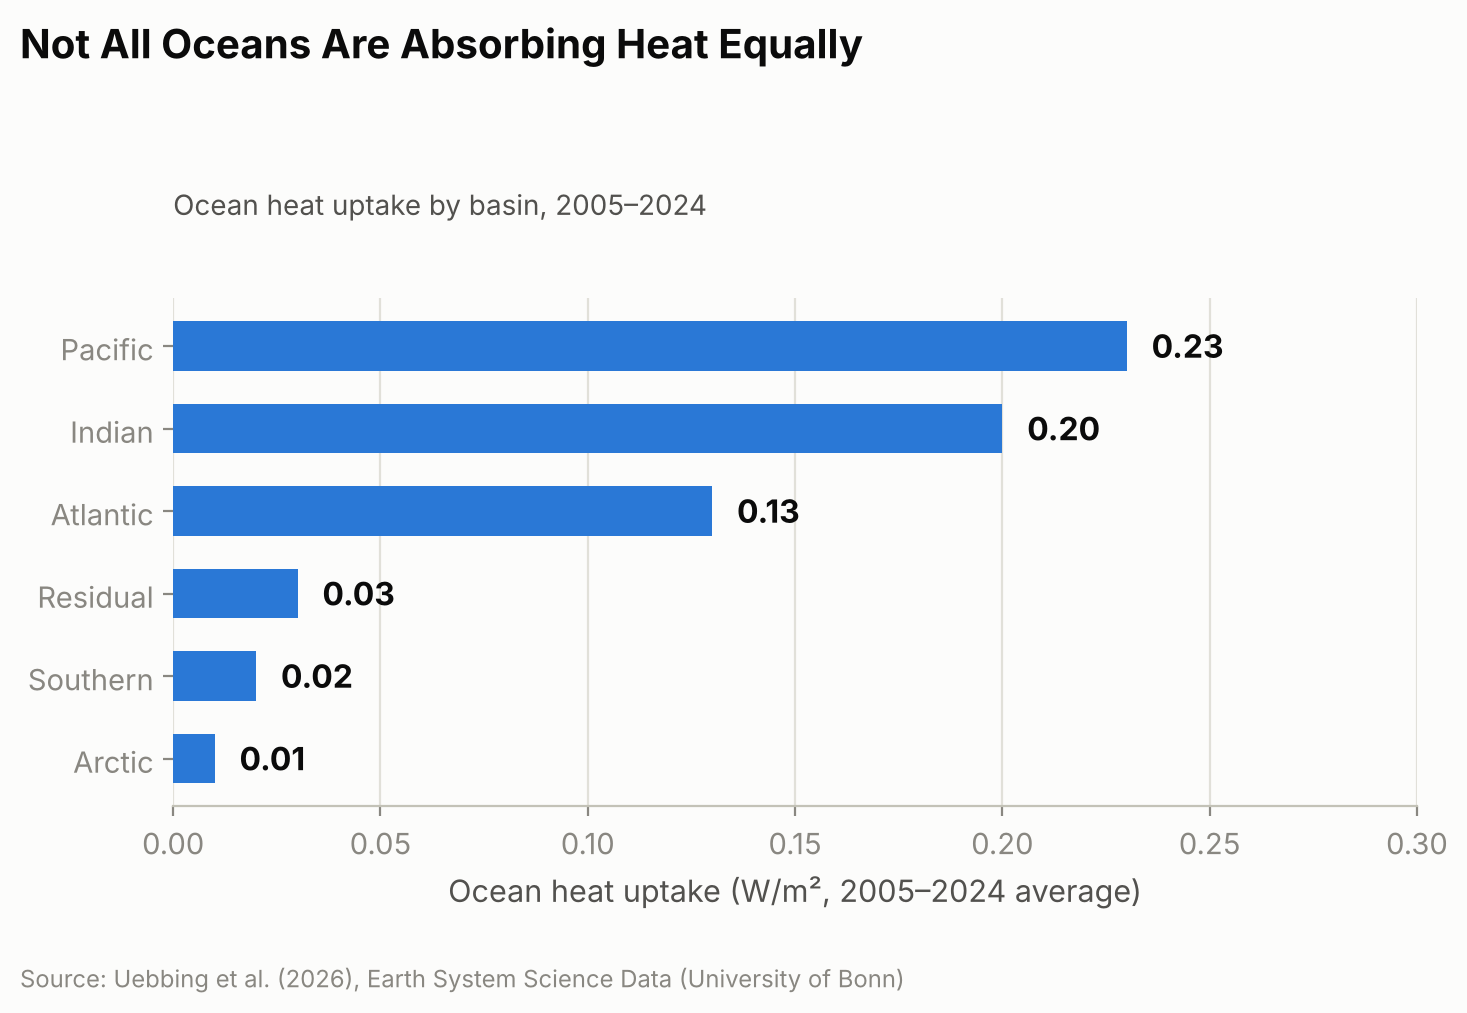
That balance, though, looks more even over 20 years than it did at the start. From 2005 to 2015, the Indian Ocean absorbed heat at a disproportionately high rate compared with its share of global ocean area. One contributor researchers point to is ocean circulation: heat transport patterns linked to the Indonesian Throughflow, a current system that channels warm Pacific water through the gaps between Indonesia’s islands into the Indian Ocean, appear to have shifted after around 2018, with larger outflows of heat carrying it away from the equatorial Indian Ocean. The study doesn’t pin down the mechanism conclusively, but that shift coincides with the broader move toward a more even split among basins that is clear in the full 20-year record. Other consequences of the same underlying warming are easier to see because they happen on land you can visit — this year’s near-record glacier melt across the Swiss Alps (the second-largest annual loss on record) is one example — even though the ocean, out of sight below the surface, is where almost all of the extra heat actually ends up.
Why Getting This Number Right Matters
Thermal expansion from ocean warming accounted for an estimated 42% of global sea-level rise between 1993 and 2015, according to the Intergovernmental Panel on Climate Change, and considerably more in some regions, so an inflated or understated ocean-heat figure can throw off coastal planning that depends on sea-level projections. The Bonn researchers also argue that ocean heat content is a steadier gauge of global warming than surface air temperature, which can swing sharply from a single hot or cool year in a way the ocean’s vast, slow-moving mass does not.
The approach is not a forecasting tool — it’s a more careful reconstruction of what has already happened, built from twenty years of historical satellite and float records. The team says extending it further back in time is limited mainly by how sparse the satellite and ocean-observing records become before the early 1990s, and they plan to incorporate upcoming missions, including proposed successors to GRACE such as GRACE-C and NGGM, to keep the record going. They also call for sustained, internationally coordinated funding for the ocean- and gravity-monitoring satellites the method depends on, warning that gaps in that coverage would make it harder to catch the next shift in where the planet’s extra heat is headed.
Sources: University of Bonn, “How Much Are the World’s Oceans Warming?”; Uebbing et al., “Improving global and regional ocean heat content by consistently combining GRACE gravity, satellite altimetry, and Argo profile observations in a joint inversion framework,” Earth System Science Data, 2026.