Tag: Climate Science

  • [Science] Climate Change Strengthened Hurricane Polo More Than El Niño, Study Finds

    [Science] Climate Change Strengthened Hurricane Polo More Than El Niño, Study Finds

    When Hurricane Polo intensified into one of the strongest and longest-lasting Category 5 hurricanes recorded in the eastern Pacific in September 2026, an exceptionally strong El Niño seemed the obvious explanation. But a rapid scientific analysis released on October 15 found that human-caused climate change had an even greater influence than El Niño on the ocean and atmospheric conditions that allowed Polo to become so extreme.

    The distinction matters because El Niño is a temporary climate pattern, while human-caused warming keeps raising the planet’s long-term temperature baseline. That means conditions capable of supporting an exceptionally intense hurricane can keep becoming more likely, even in years when El Niño is absent altogether.

    原論文情報 / Original Paper
    Title: Effect of climate change at least as large as El Niño in strengthening Hurricane Polo
    Authors: Friederike Otto et al. (World Weather Attribution / Climate Central)
    Journal: World Weather Attribution rapid report, Grantham Institute, Imperial College London (not yet peer-reviewed)
    DOI: 10.25560/144926

    A Record-Breaking Storm, Dissected

    Hurricane Polo intensified explosively over the eastern Pacific in late September 2026, with maximum sustained winds climbing by roughly 90 knots (about 167 km/h) in 24 hours — a jump the US National Hurricane Center called “truly remarkable.” The storm peaked at about 165 mph (265 km/h), Category 5 strength, and the Associated Press described it as the longest-lasting Category 5 storm on record in the Pacific. Polo went on to make landfall in Mexico’s Baja California Sur and cross into Sonora, and the flooding that followed killed at least five people across Jalisco and Sonora, according to local reports cited in the WWA assessment; roughly 1,000 people were evacuated in New Mexico over fears a dam could fail.

    As soon as the storm weakened, World Weather Attribution (WWA) — the international scientist network known for analyzing extreme weather events within days of them happening, rather than waiting years for a full peer-reviewed study — teamed up with the nonprofit Climate Central to work out how much of Polo’s power came from decades of ocean warming versus this year’s unusually strong El Niño. The team included researchers based in Mexico, the United States, the United Kingdom, Ireland and the Netherlands, working with partners at Imperial College London, the Royal Netherlands Meteorological Institute (KNMI) and the Red Cross Red Crescent Climate Centre.

    Three Ways to Measure the Effect

    To separate the two influences, the researchers mainly relied on a measure called “potential intensity” — a thermodynamic estimate, built from sea-surface temperature, air temperature and humidity, of the strongest a storm could theoretically become in a given patch of ocean. It is not a prediction of the exact wind speed a real storm will reach, since that also depends on wind shear, storm structure and other factors. The team compared potential intensity in the real, warmed-up world against a hypothetical world without human-caused warming, and separately against a world without this year’s El Niño.
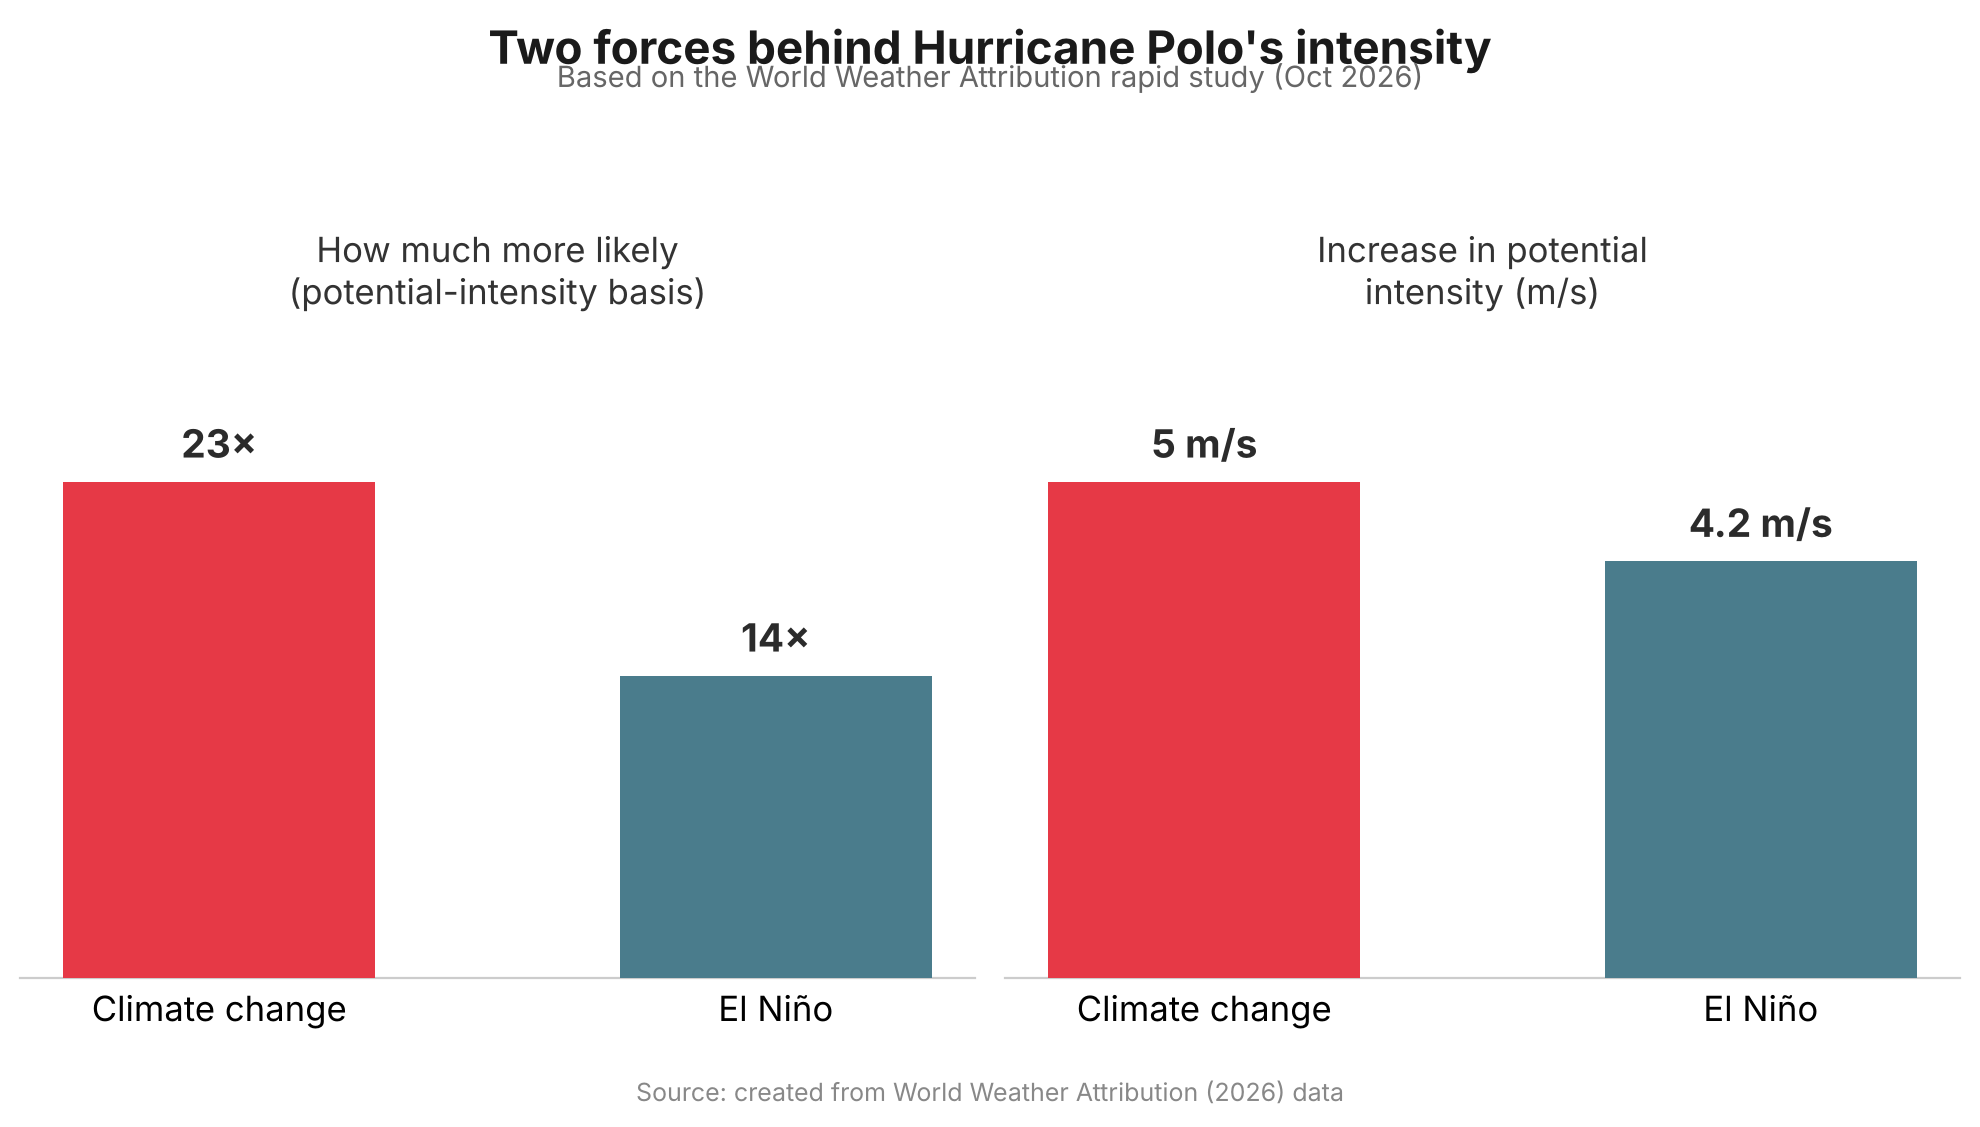
    Bar chart comparing climate change and El Nino's contribution to Hurricane Polo's intensity
    Source: created from World Weather Attribution (2026) data

    The results point the same way on multiple measures. Conditions associated with Polo’s extreme potential intensity were estimated to be about 23 times more likely in today’s climate than in a world without human-caused warming — roughly a 1-in-115-year event — compared with about 14 times more likely from this year’s El Niño relative to neutral conditions, roughly a 1-in-70-year event. In terms of potential intensity itself, climate change added an estimated 5 m/s, versus about 4.2 m/s from El Niño. Separately, the researchers estimated that climate change increased Polo’s actual peak wind speed by about 2.7 m/s, or roughly 6 mph. The ocean water Polo crossed was also assessed on its own: it was about 1.4°C warmer than it would have been in a pre-industrial climate, a level of warmth made roughly 100 to 200 times more likely by climate change.

    Why a Few Miles an Hour Matters

    A few extra miles per hour might not sound dramatic, but it is not a small thing physically. The kinetic energy wind carries rises roughly with the cube of its speed, so a modest increase in wind speed can translate into a disproportionately larger jump in the force a storm can exert — even before accounting for how a particular coastline’s buildings, storm surge and terrain shape the actual damage. That nonlinearity is why hurricane scientists pay close attention to marginal gains in wind speed, and why researchers note that a storm carrying Polo’s extra climate-driven intensity toward a more densely populated coastline could have caused significantly more damage than it did striking a relatively sparsely populated stretch of Mexico.

    El Niño Fades, Warming Doesn’t

    “El Niño comes and goes, but climate change only gets worse.”

    That line, from WWA’s Friederike Otto, captures why the study’s authors consider the finding noteworthy even though El Niño’s own contribution was substantial. El Niño is a natural, temporary swing in Pacific Ocean temperatures that typically lasts anywhere from several months to a year or more before fading. Climate Central’s Daniel Gilford has compared the two influences to a traffic light and an accelerator: in some regions, El Niño can reduce the high-altitude wind shear that would otherwise tear a storm apart, acting like a green light, while warmer ocean water supplies extra heat and moisture that fuel a storm once it starts to intensify. Neither factor guarantees a storm will intensify, but the light will eventually turn red again as El Niño fades. The long-term warming trend, tied to the heat still accumulating in the climate system, does not reset the same way.

    What the Study Can and Can’t Show

    The analysis has not yet been peer-reviewed, which is standard for WWA’s rapid-response studies — the trade-off the group accepts in order to publish within days of a disaster rather than months later. The researchers also tried to quantify climate change’s effect on Polo’s extreme rainfall, but found that available climate models could not reproduce historical rainfall trends in the region closely enough to draw a reliable conclusion, so they left that question open rather than guess.

    Separately, the Associated Press reported that several hurricane scientists not involved in the study — including Jeff Masters, Michael Mann and Carl Schreck — have suggested the climate-change contribution to Polo could be an underestimate, pointing to a 2024 study by Gilford that found climate change added as much as 16 mph to some Atlantic hurricanes. Gilford, a co-author of the new Polo study, told the AP he sees the new analysis as a deliberately conservative one. Either way, the study’s authors are careful to say it shows that a warmer world raised the odds of extreme conditions for this particular storm — not that every future hurricane will necessarily be stronger than the ones before it.

    What This Means Going Forward

    Polo fits a broader pattern this blog has covered before: this year’s global climate indicators report found that seven of sixteen tracked planetary vital signs hit record extremes in 2026, with warming accelerating rather than leveling off. Polo’s real significance may be less about one storm and more about the baseline it was built on. El Niño years will keep arriving and receding on their own schedule, occasionally stacking with warm oceans to produce an especially intense storm. But because the underlying warming trend persists between those cycles, each future El Niño has a slightly warmer ocean to draw on than the last one did — which is exactly the mechanism this study was designed to isolate.

    Sources: World Weather Attribution, The Associated Press (via KSAT), NASA Earth Observatory, Full study (Imperial College London)

  • [Science] Earth’s Climate Indicators Hit Record Extremes in 2026 as Warming Speeds Up

    [Science] Earth’s Climate Indicators Hit Record Extremes in 2026 as Warming Speeds Up

    A new annual climate report finds that seven of Earth’s sixteen tracked climate indicators, including ocean heat, sea level, and ice loss, have reached record extremes in 2026. Just as notable, the authors estimate that the rate of global surface warming has climbed sharply over the past few decades. The findings matter well beyond climate science circles: if the recent pace continues, warming thresholds long treated as distant milestones could arrive within the working lifetime of people reading this, not generations from now.

    The Planet, Checked Like a Patient

    The findings come from “The 2026 State of the Climate Report: Challenges and Opportunities,” published on October 14, 2026 in the peer-reviewed journal BioScience. It is the latest edition of an annual series led by William Ripple, a distinguished professor at Oregon State University’s College of Forestry, and Christopher Wolf of Terrestrial Ecosystems Research Associates, with co-authors including climate scientist Michael Mann of the University of Pennsylvania and Johan Rockström of the Potsdam Institute for Climate Impact Research.

    The authors track sixteen “planetary vital signs” to monitor changes in Earth’s climate system. These include atmospheric greenhouse gas concentrations, global surface temperature, ocean heat content (the total heat stored in ocean water, including far below the surface, not just sea-surface temperature), sea level, and ice loss. Alongside these, they track the human activities behind the changes, such as fossil fuel consumption and the growth of renewable energy. Much as a doctor reads blood pressure or heart rate over time rather than relying on one measurement, the point of this framework is to follow a consistent set of numbers year after year, rather than judging the climate by any single dramatic event.

    Record Extremes and a Faster Warming Rate

    Of the sixteen indicators, seven, or 44 percent, are now at record extremes. Atmospheric carbon dioxide exceeded 428 parts per million (meaning about 428 CO₂ molecules per million molecules of dry air) in May 2026, roughly 50 percent above pre-industrial levels. Methane and nitrous oxide, two other greenhouse gases, also reached record levels based on year-to-date 2026 averages, though as the year is not yet complete, these figures remain provisional.

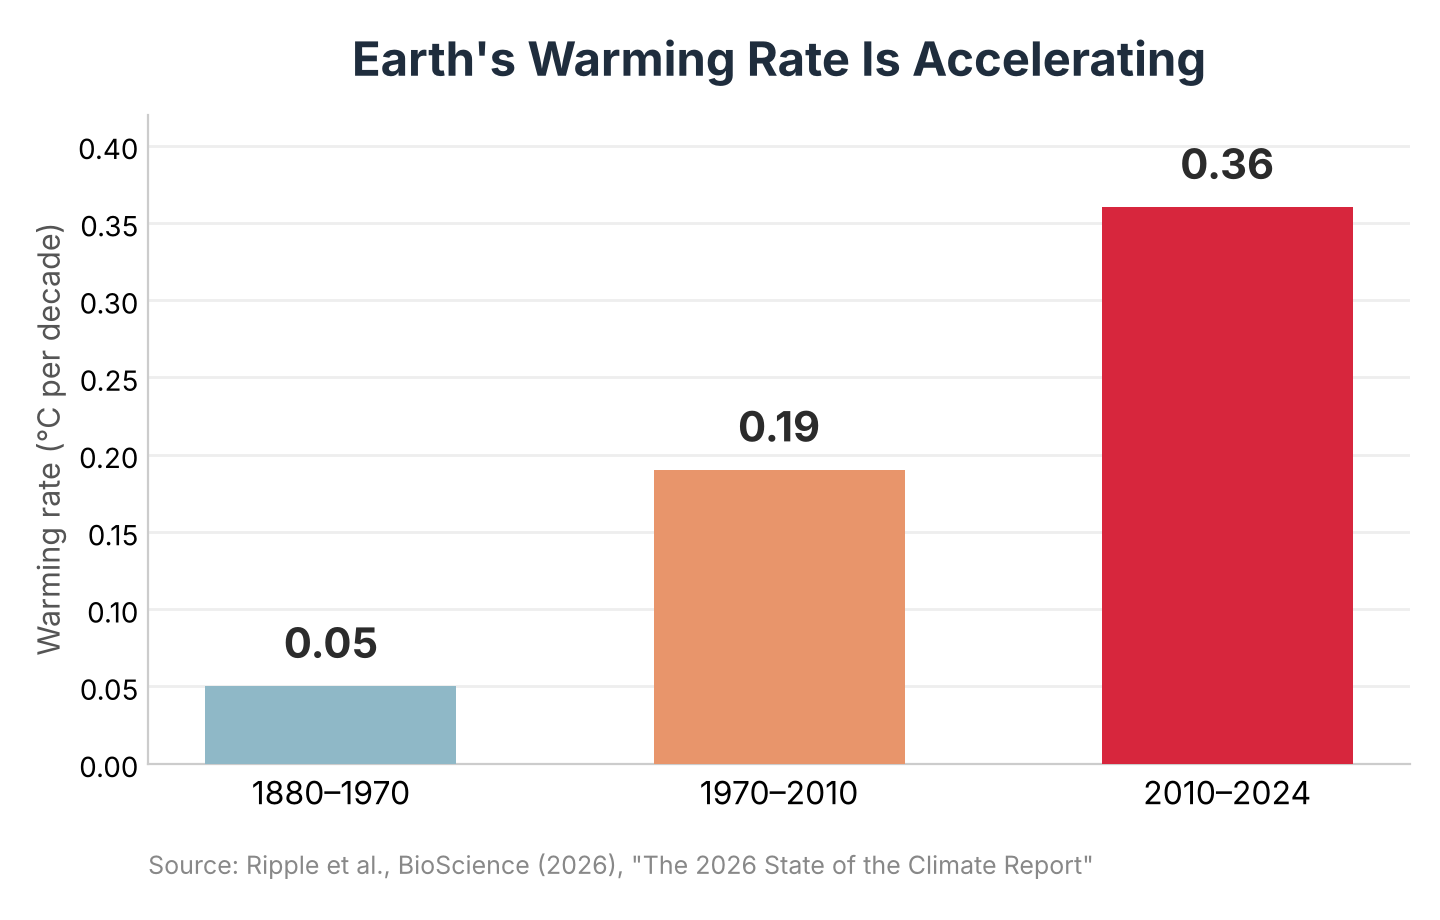
    The report’s warming-rate estimate is one of its most discussed figures. Using a segmented trend analysis, the authors put the rate of global surface warming at roughly 0.05 degrees Celsius per decade between 1880 and 1970, rising to about 0.19 degrees per decade between 1970 and 2010, and then to about 0.36 degrees per decade between 2010 and 2024. That is roughly seven times the earliest rate, though comparing periods of such different lengths calls for some caution: the most recent interval spans only 14 years, so it is more exposed to short-term swings such as El Niño than the 90-year span at the start of the record. Even allowing for that, the direction, a clearly faster recent pace, is consistent across the three periods. If this recent rate were to persist, the authors warn, warming could pass 2 degrees Celsius above pre-industrial levels before 2050; that is a conditional extrapolation from the observed trend, not a guaranteed forecast, since both natural variability and future policy choices could shift it either way.

    The rate of global surface warming rose from about 0.05°C per decade before 1970 to about 0.36°C per decade since 2010 — roughly seven times faster.
    Bar chart showing global warming rate rising from 0.05 to 0.19 to 0.36 degrees Celsius per decade across three periods
    Source: Ripple et al., BioScience (2026), “The 2026 State of the Climate Report”

    The authors describe several indicators as showing accelerating trends or abrupt shifts that could make some future changes harder to anticipate than the steadier patterns of past decades.

    Oceans and Ice Absorb the Impact

    Much of the planet’s response to rising greenhouse gases plays out beneath the ocean surface rather than in the air people breathe. The report finds ocean heat content and global sea level at record highs, while glacier thickness and the mass of the Greenland ice sheet sit at record lows. Energy-related carbon dioxide emissions, meanwhile, passed 41 gigatons for the first time in 2025.

    The overall trend is clear, although scientists continue to refine how they measure ocean heat uptake region by region. A separate study published this month by researchers at the University of Bonn combined satellite and ocean-float data to estimate how much heat different ocean basins are absorbing. For the Indian Ocean during 2005–2015, the new estimate came in at 0.58 watts per square meter, against 1.09 watts per square meter from a commonly used climate reanalysis dataset, ORAS5, a nearly two-fold gap for that basin and period specifically. Xsciens covered that study in more detail here. The gap does not overturn the broader picture that oceans are absorbing most of Earth’s excess heat; it is a reminder that even well-established indicators like ocean heat content keep being refined as measurement methods improve.

    Glaciers are a visible, land-based counterpart to that underwater story. Switzerland’s glacier monitoring network reported that Swiss glaciers lost roughly 5.5 percent of their ice volume in 2026, the second-largest annual loss on record after 2022, a sign that frozen water reserves relied on for seasonal water supply are shrinking at a pace that leaves less room for error in regional water planning.

    The Human Toll, and How to Read It

    The report documents a series of disasters from the past year that illustrate the human costs of extreme weather. Hurricane Melissa, which struck the Caribbean in October 2025, caused 95 deaths and more than 12 billion dollars in damage. A separate storm in November 2025, combined with monsoon flooding in Indonesia, killed 708 people. A June 2026 heatwave across Europe is associated, in a preliminary statistical estimate, with around 14,000 excess deaths, meaning deaths above the number that would normally be expected, calculated from mortality data and a model rather than counted individually; the figure is not yet finalized and could be revised.

    The report’s authors write that these events “were at least partly attributable to climate change,” a deliberately qualified statement: it does not claim that any single storm or heatwave would have been impossible without global warming, but that warming is believed to have raised the odds or intensity of each one to some degree. That is consistent with how formal event-attribution science generally works, comparing the likelihood of an event in today’s warmer climate against a hypothetical world without human-caused warming, rather than issuing a simple yes-or-no verdict.

    Beyond individual disasters, the authors flag rising risk around climate “tipping points”: thresholds beyond which feedbacks could drive changes that become difficult, or in some cases effectively impossible, to reverse on human timescales. Two examples they highlight are a weakening of the Atlantic Meridional Overturning Circulation, the ocean current system that helps regulate temperatures across the North Atlantic region, and the risk of large-scale Amazon rainforest dieback, which the report suggests could be triggered by the combined effects of warming and deforestation at as little as 1.5 to 1.9 degrees Celsius of warming. The authors describe continued warming and interacting feedbacks as raising the risk of a self-reinforcing “hothouse” trajectory, marked by weakening natural carbon sinks and accelerating ice loss, though they present this as an elevated risk worth monitoring closely, not an outcome they predict is imminent.

    A Mixed Picture on Energy

    The report is not uniformly bleak. Low-carbon energy sources collectively supplied about 43 percent of global electricity in 2025, and solar and wind consumption grew by roughly 18 percent over the previous year. For the first time in more than a century, renewable energy sources globally surpassed coal as an electricity source. Battery storage, which helps make intermittent solar and wind power more usable around the clock, is also expanding quickly.

    Yet the authors are blunt that this progress remains far short of what is needed. Global fossil fuel consumption still rose by 0.9 percent in 2025, because rising overall energy demand has outpaced the growth of clean alternatives rather than being displaced by them. On adaptation, the gap is starker still: the report cites roughly 64 billion dollars in international public adaptation finance reaching developing countries in 2024, against an estimated need of 310 to 365 billion dollars per year by 2035.

    What the Report Recommends

    The authors call for pursuing rapid cuts to greenhouse gas emissions alongside faster investment in adaptation and resilience, rather than treating the two as separate tracks. They point to measures such as mangrove and wetland restoration, which both protect coastlines and store carbon, early warning systems for extreme weather, and a stronger emphasis on climate justice so that adaptation funding reaches local and frontline communities rather than only large infrastructure projects. They also point to interactive public tools, such as the En-ROADS climate simulator and the Drawdown Explorer, for evaluating the trade-offs between different policy choices.

    The report does not predict inevitable catastrophe. It documents a climate system under increasing, and in some respects accelerating, pressure, while pointing to specific areas where policy and technology can still change the trajectory. Its underlying message is less a single verdict than a status update: of sixteen vital signs checked in 2026, seven are flashing red, the pace of change is quickening, and the choices made over the next few years will help determine how many more join them.

    Sources: American Institute of Biological Sciences / EurekAlert, Ripple et al., “The 2026 State of the Climate Report,” BioScience (2026), University of Bonn, GPB/NPR on Swiss glacier loss

  • How Much Are the World’s Oceans Really Warming? A New Method Finds a Large Gap With a Widely Used Climate Estimate — and Heat Moving Unevenly Between Ocean Basins

    How Much Are the World’s Oceans Really Warming? A New Method Finds a Large Gap With a Widely Used Climate Estimate — and Heat Moving Unevenly Between Ocean Basins

    • Almost all of the extra heat trapped by human-caused warming ends up in the ocean, so how well we can measure that heat shapes how much we can trust climate tracking and forecasts of rising seas.
    • German researchers built a new way to estimate that heat, combining data from floating ocean sensors and two kinds of satellites to recalibrate the computer reconstructions scientists normally rely on.
    • For part of the past two decades, one widely used reconstruction estimated far more ocean heat uptake than the new study did — in one stretch, nearly double.
    • The heat also hasn’t spread evenly: the Indian Ocean absorbed an outsized share between 2005 and 2015, a pattern that has since become more evenly spread across the Pacific, Indian, and Atlantic Oceans.

    Why the Ocean’s Heat Bill Matters

    Earth is currently taking in more heat from the sun than it radiates back out to space, mainly because greenhouse gases trap extra energy near the surface. Almost all of that surplus heat — roughly 90%, according to the new study — ends up in the ocean rather than in the air or on land. By absorbing so much of that excess energy, the ocean slows down how fast the atmosphere and land surface heat up, which is a large part of why it’s one of the most closely watched numbers in climate science.

    Scientists actually track two related but different numbers here: ocean heat content, meaning how much extra heat is already stored in the ocean, and ocean heat uptake, meaning how fast the ocean is gaining more of it, usually measured in watts per square meter of ocean surface. This story is mostly about the second number — the uptake rate, and how it differs from one ocean region to the next. As seawater heats up, it also expands slightly, a process called thermal expansion (think of a thermometer, where the liquid rises in the tube as it warms and takes up more space). That expansion drives a significant share of global sea-level rise.

    Getting a precise number for how fast the ocean is taking up heat, and where, turns out to be surprisingly hard. Researchers at the University of Bonn in Germany, in a study published in October 2026 in the journal Earth System Science Data, set out to make that accounting more reliable — and to see how it compares with the estimates climate scientists currently rely on.

    Three Data Sources, One Recalibrated Picture

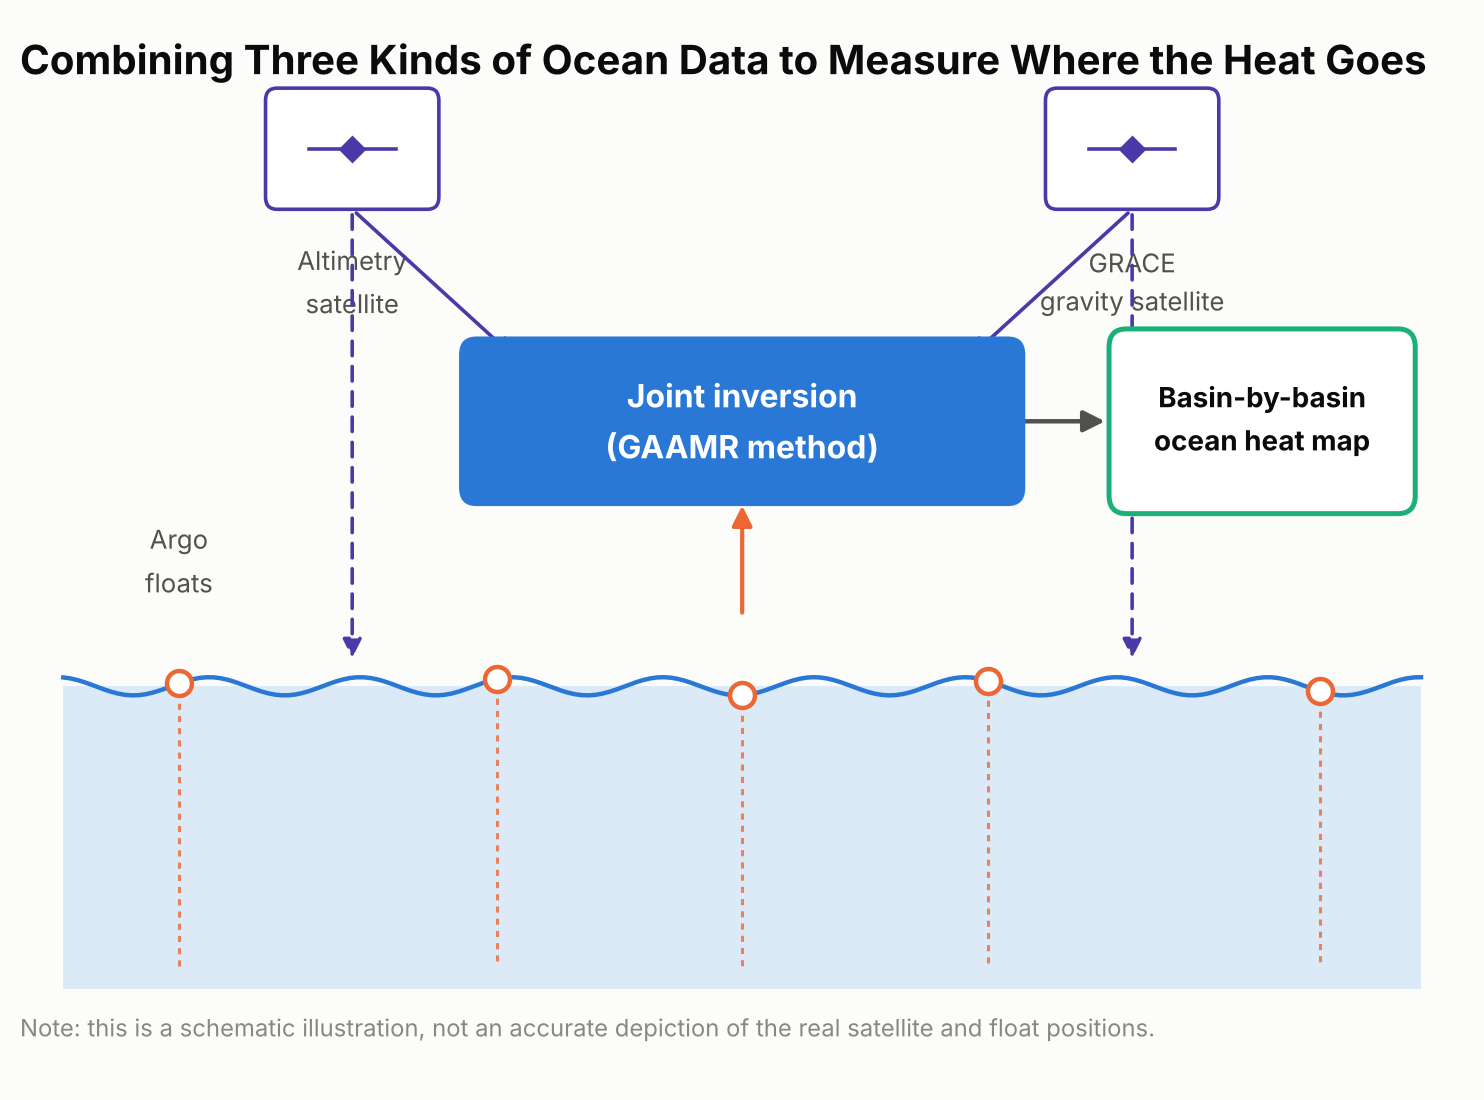
    No one can scoop up the ocean and measure its heat directly. Scientists instead combine indirect clues, and each one has blind spots on its own. The Bonn team’s new approach, which they call GAAMR (Grace, Altimetry and Argo Mode Rescaling), draws on three streams of satellite and ocean data: two satellite-based measurements and one array of ocean-going floats.

    The first is a global fleet of thousands of drifting robotic sensors called Argo floats, which sink and rise through the upper two kilometers of the ocean roughly every ten days, recording temperature and salinity as they go; Argo samples the upper ocean far more densely than the deep ocean, so deeper water is handled differently, as explained below. The second is satellite radar altimetry, which tracks the height of the sea surface from orbit; averaged over time, it can measure global sea-level trends to within a couple of millimeters a year, and warmer water takes up more space, so part of that rise reflects ocean expansion. The third is data from GRACE, a pair of satellites that detect tiny shifts in Earth’s gravity field caused by moving mass on and near the surface, including ice sheets, glaciers, and water stored on land. That gravity data helps researchers separate the part of sea-level rise caused by this extra mass from the part caused by the ocean simply expanding as it warms.

    Importantly, the new method isn’t a model-free measurement. It still starts from an ocean model — the same ORAS5 reanalysis used for comparison below — to map out the likely regional patterns of warming. What’s different is that, rather than trusting those modeled patterns at face value or applying one global adjustment factor to the whole ocean, the researchers rescale the patterns region by region using the real satellite and float observations. That regional rescaling, instead of a single worldwide correction, is the method’s main innovation, and it produces monthly, region-by-region estimates of ocean heat uptake rather than one rough global figure.

    Schematic diagram showing the three data sources combined in the GAAMR method: Argo floats, satellite altimetry, and GRACE gravity measurements
    The GAAMR method combines three data sources — Argo floats, satellite altimetry, and GRACE gravity data — to rescale ocean heat uptake estimates region by region.

    What the New Numbers Show

    Added up across the whole ocean, the new approach lines up reasonably well with several other independent estimates: it puts global ocean heat uptake from 2005 through 2024 at 0.62 watts per square meter, averaged over every patch of ocean surface on Earth. That figure is broadly consistent with estimates built from the Argo float network alone and with NASA’s CERES satellite measurements of Earth’s energy budget.

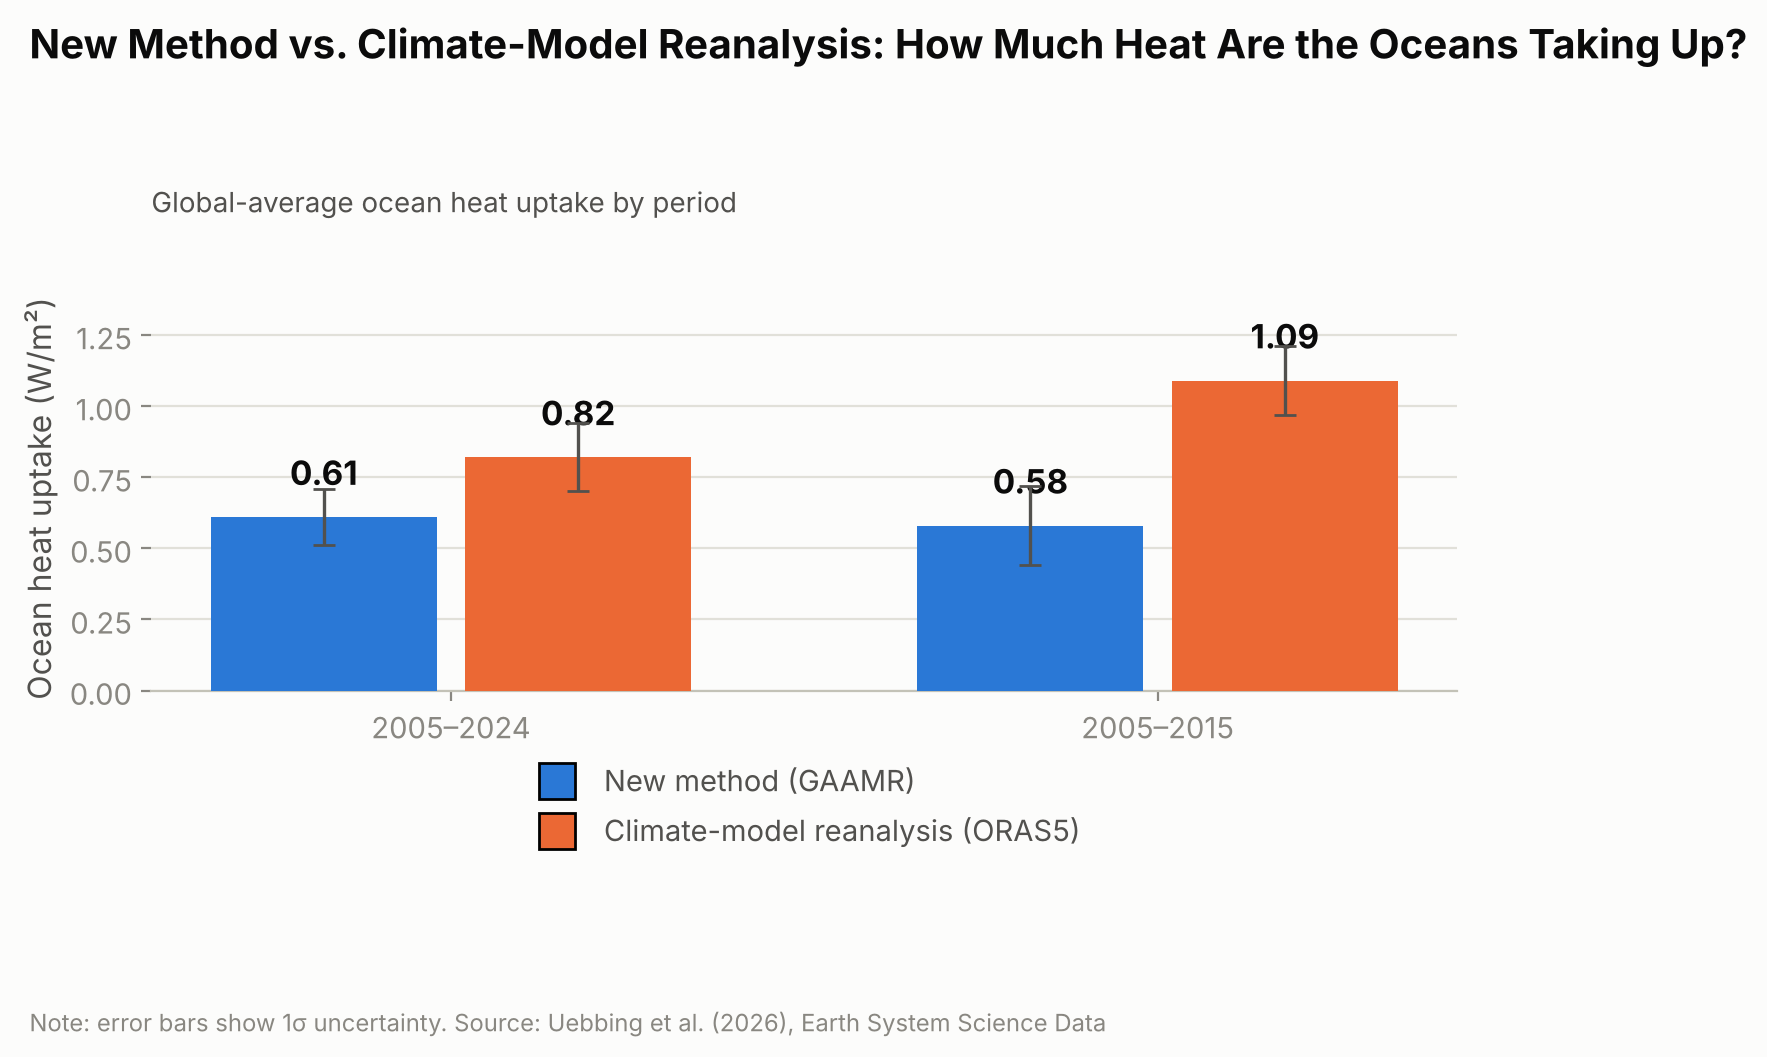
    Where the new estimate diverges is in comparison with ORAS5 specifically — a widely used “ocean reanalysis,” meaning a computer reconstruction that blends an ocean circulation model with whatever real-world observations are available, rather than a forward-looking climate projection. Over 2005–2024, ORAS5 put global ocean heat uptake at about 0.82 watts per square meter, roughly a third higher than the new study’s figure. The gap was much larger for the first half of that period.

    For 2005 to 2015, ORAS5 estimated ocean heat uptake at 1.09 watts per square meter, compared with 0.58 watts per square meter from the new GAAMR reconstruction — almost double.

    Bar chart comparing ocean heat uptake in watts per square meter from ORAS5 and the new GAAMR method for 2005 to 2024 and 2005 to 2015
    For 2005 to 2015 alone, the gap between ORAS5 and the new GAAMR estimate is nearly twofold.

    The researchers are careful not to frame this as proof that climate models in general overstate ocean warming. Their own result broadly agrees with several independent observational estimates; the clearer gap is specifically with ORAS5, suggesting that particular reanalysis may be overstating how fast the ocean has taken up heat, especially during the 2005–2015 decade.

    Heat on the Move: Why Some Ocean Basins Differ

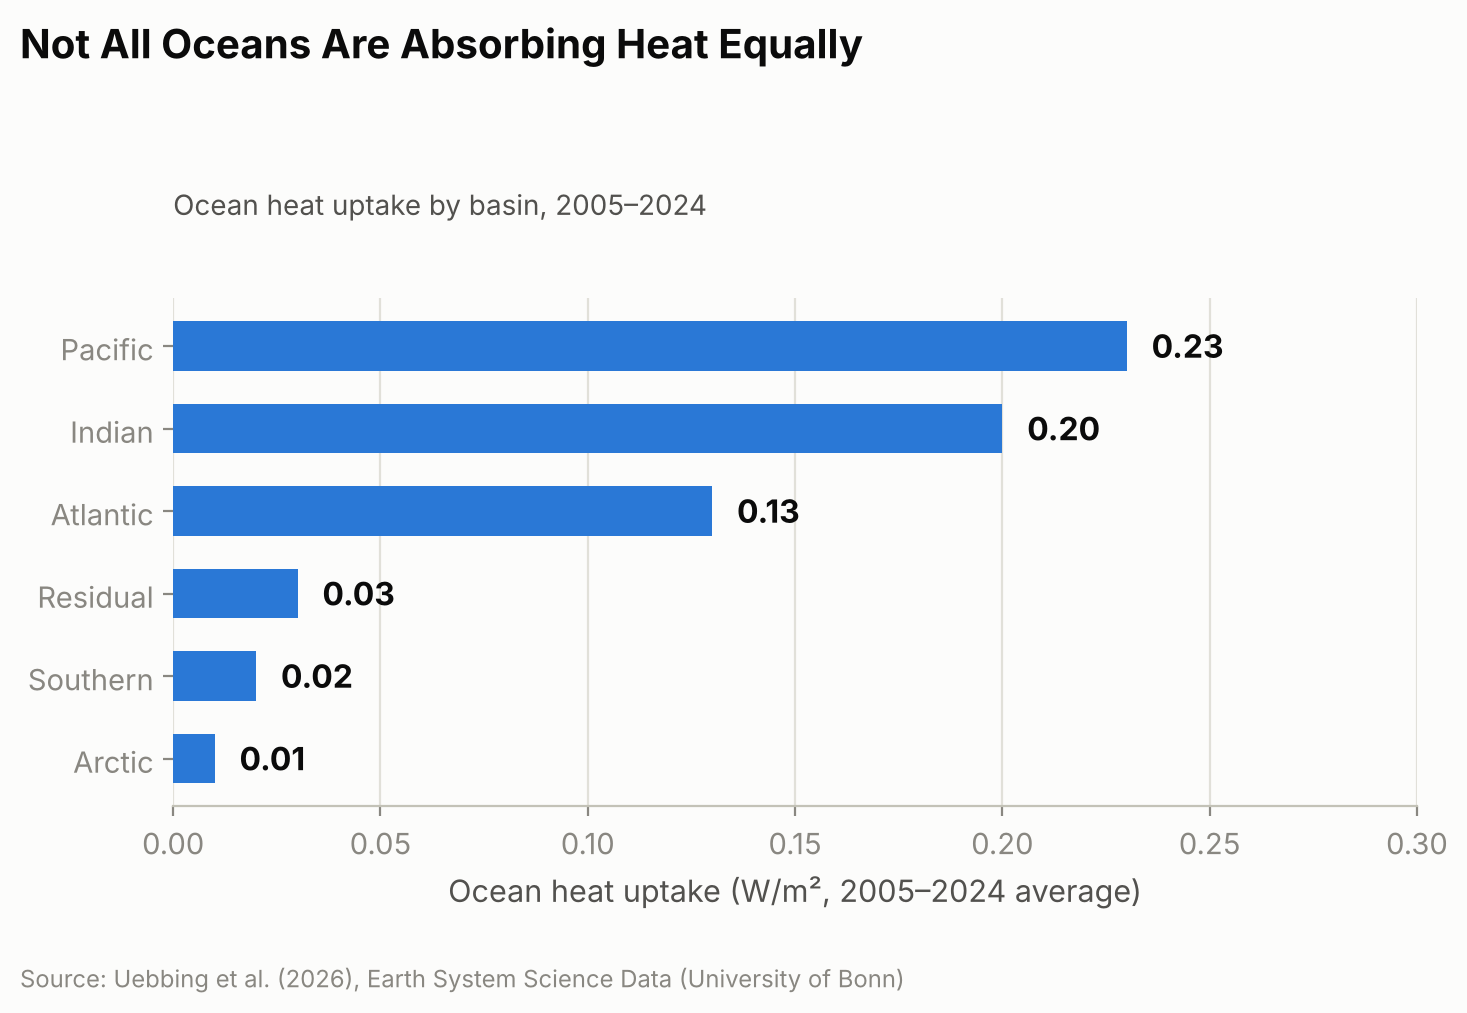
    The new regional estimates also reveal something a single global number can’t: heat hasn’t been spreading evenly across the world’s oceans. Over the full 2005–2024 period, the Pacific, Indian, and Atlantic Oceans together accounted for the large majority of the extra heat, with the Pacific absorbing the most, followed closely by the Indian Ocean and then the Atlantic. The Southern Ocean and Arctic Ocean, despite their size, contributed only a few percent combined.

    Horizontal bar chart showing the regional breakdown of ocean heat uptake by basin for 2005 to 2024, covering the Pacific, Indian, Atlantic, Southern, and Arctic Oceans and a residual term
    The Pacific, Indian, and Atlantic Oceans together account for the large majority of the added heat.

    That balance, though, looks more even over 20 years than it did at the start. From 2005 to 2015, the Indian Ocean absorbed heat at a disproportionately high rate compared with its share of global ocean area. One contributor researchers point to is ocean circulation: heat transport patterns linked to the Indonesian Throughflow, a current system that channels warm Pacific water through the gaps between Indonesia’s islands into the Indian Ocean, appear to have shifted after around 2018, with larger outflows of heat carrying it away from the equatorial Indian Ocean. The study doesn’t pin down the mechanism conclusively, but that shift coincides with the broader move toward a more even split among basins that is clear in the full 20-year record. Other consequences of the same underlying warming are easier to see because they happen on land you can visit — this year’s near-record glacier melt across the Swiss Alps (the second-largest annual loss on record) is one example — even though the ocean, out of sight below the surface, is where almost all of the extra heat actually ends up.

    Why Getting This Number Right Matters

    Thermal expansion from ocean warming accounted for an estimated 42% of global sea-level rise between 1993 and 2015, according to the Intergovernmental Panel on Climate Change, and considerably more in some regions, so an inflated or understated ocean-heat figure can throw off coastal planning that depends on sea-level projections. The Bonn researchers also argue that ocean heat content is a steadier gauge of global warming than surface air temperature, which can swing sharply from a single hot or cool year in a way the ocean’s vast, slow-moving mass does not.

    The approach is not a forecasting tool — it’s a more careful reconstruction of what has already happened, built from twenty years of historical satellite and float records. The team says extending it further back in time is limited mainly by how sparse the satellite and ocean-observing records become before the early 1990s, and they plan to incorporate upcoming missions, including proposed successors to GRACE such as GRACE-C and NGGM, to keep the record going. They also call for sustained, internationally coordinated funding for the ocean- and gravity-monitoring satellites the method depends on, warning that gaps in that coverage would make it harder to catch the next shift in where the planet’s extra heat is headed.

    Sources: University of Bonn, “How Much Are the World’s Oceans Warming?”; Uebbing et al., “Improving global and regional ocean heat content by consistently combining GRACE gravity, satellite altimetry, and Argo profile observations in a joint inversion framework,” Earth System Science Data, 2026.

  • [Science] Swiss Glaciers Lost 5.5% of Their Ice in 2026 — A Preview of Tighter Summer Water Supplies Across the Alps

    [Science] Swiss Glaciers Lost 5.5% of Their Ice in 2026 — A Preview of Tighter Summer Water Supplies Across the Alps

    Switzerland’s glaciers lost about 5.5% of their ice volume during the 2025/2026 measurement year, the second-largest annual loss in the GLAMOS monitoring record after 2022. Over the past five years, Switzerland has lost nearly one-fifth of its glacier ice — a five-year loss rate more than twice that of any previous five-year period in the record. The pace matters well beyond Switzerland’s borders: meltwater from its glaciers helps sustain the Rhône, the Rhine, and other rivers that millions of people downstream rely on for drinking water, farming, and electricity, particularly during hot, dry summers.

    A second-worst year, right after the worst five-year stretch on record

    The figures come from GLAMOS, Switzerland’s long-term glacier monitoring network, run jointly by ETH Zurich and the universities of Fribourg and Zurich, which carries out detailed annual mass-balance measurements on 23 Swiss glaciers each year. Its 2025/2026 annual report puts the average “mass balance” — the net change in a glacier’s mass, expressed as meters of water equivalent (m w.e.), a way of converting accumulated snow minus melt into an equivalent depth of water spread over the glacier — at −2.86 m w.e. That is the second-most negative year GLAMOS has recorded, behind only 2022’s −3.13 m w.e.

    Converted into ice volume, the 2025/2026 melt amounted to roughly 5.5% of Switzerland’s glacier ice. Ten of the 23 monitored glaciers lost more than 3 meters of water equivalent; Tsanfleuron fared worst at −3.9 m w.e., while Findel, near the Matterhorn, recorded the smallest loss, at −2.3 m w.e. Four glaciers — Allalin, Clariden, the Grosser Aletsch (the largest glacier in the Alps), and the Rhone glacier — recorded the greatest annual mass loss in their observational history.

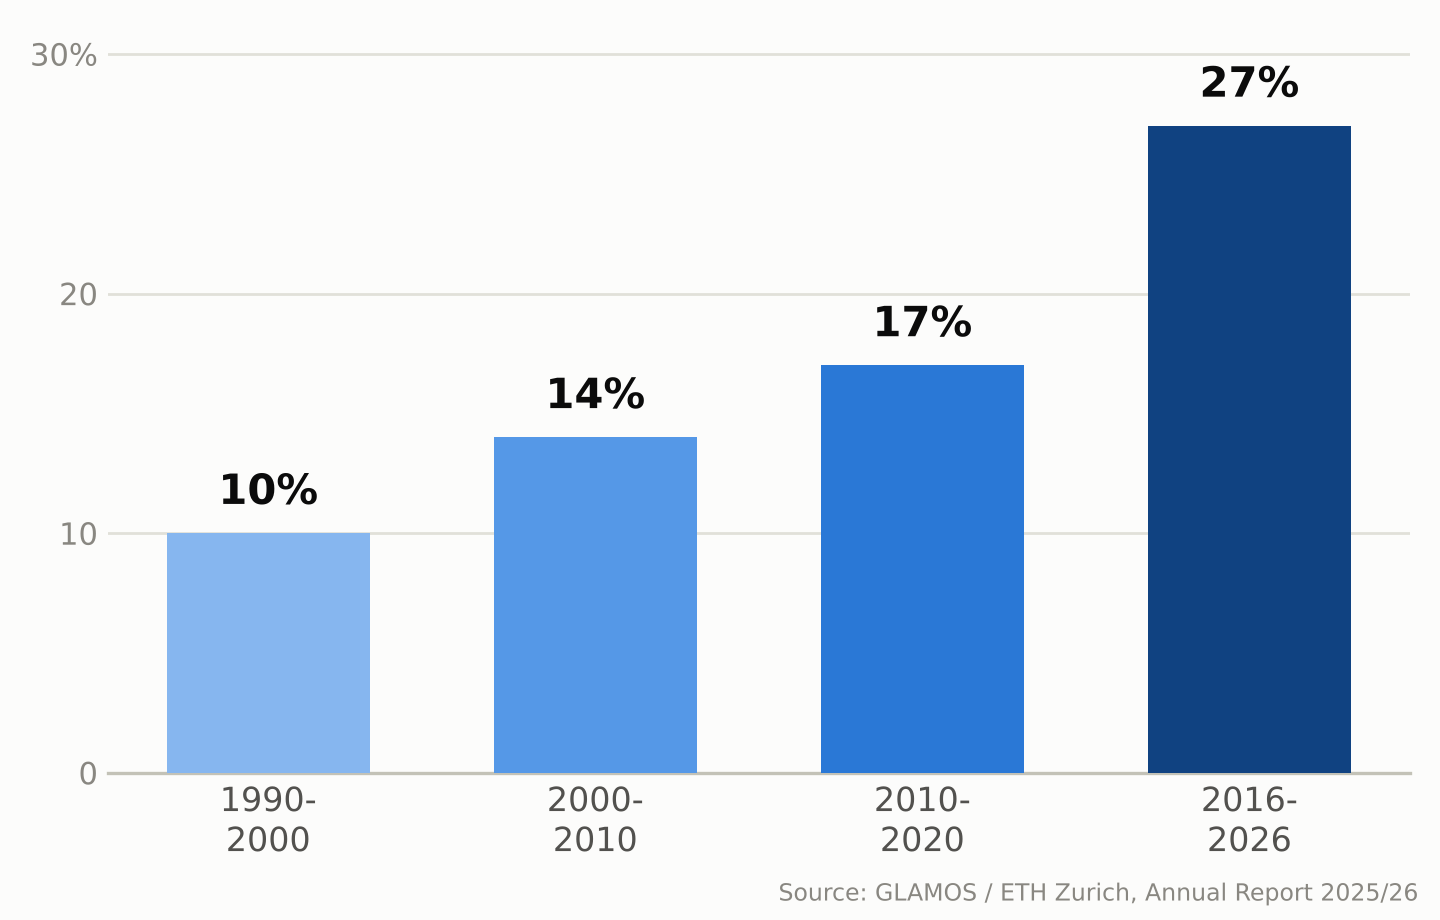
    Zoom out and the five-year picture is starker. Since 2021, Swiss glaciers have lost close to 20% of their remaining volume — a loss rate GLAMOS describes as more than twice as fast as any earlier five-year period in its record. The longer-term picture shows the same acceleration: Swiss glaciers lost about 10% of their volume in 1990–2000, 14% in 2000–2010, 17% in 2010–2020, and about 27% over the most recent ten-year window, 2016–2026.

    Bar chart showing Swiss glacier ice volume loss by decade: 10% in the 1990s, 14% in the 2000s, 17% in the 2010s, and 27% in 2016-2026
    Share of ice volume lost by Swiss glaciers, by decade. Source: GLAMOS / ETH Zurich, Annual Report 2025/26.

    Why this past year was so bad

    Two seasons combined to make 2025/2026 so damaging. Winter snowfall came in about 25% below the long-term average by the end of April, leaving glaciers with a thin protective layer heading into summer. The following April–September period was, according to glaciologist Matthias Huss, who leads GLAMOS and is a professor at ETH Zurich, the hottest and driest “summer half-year” in Switzerland since national weather records began in 1864. The freezing level — the altitude of the 0°C mark in the atmosphere — rose above 4,000 meters on 76 days, more than double the average and a new Swiss record. By September, snow cover had disappeared even at elevations around 3,500 meters.

    GLAMOS calls the point when melt overtakes the winter’s snow gains — after which every melted liter comes straight out of the glacier’s mass — “Glacier Loss Day.” In 2026 that point arrived on June 29, the second-earliest date on record, three days later than the record set in 2022. One reason 2026 still fell just short of 2022’s record was the smaller amount of Saharan dust deposited on the snow that year, which let glaciers reflect more sunlight than they did in 2022, when dust darkened the surface and accelerated melting.

    Melting is also carving cavities and collapse zones into some glaciers

    Researchers monitoring the retreat describe an additional process layering on top of ordinary surface melting. On some glacier tongues, meltwater penetrates and flows through the ice, forming channels and cavities; where these grow large enough, sections of ice can collapse inward rather than simply retreating at the edges. Huss has described visiting high-altitude sites that were still covered in ice a few years ago — including areas near the Grosser Aletsch’s Konkordiaplatz and around the Findel glacier by the Matterhorn — and finding bare, rubble-strewn rock he compared to a lunar landscape.

    Some glaciers are also disappearing outright. The Bella Tola glacier in canton Valais, which had been measured for decades, is among the small glaciers researchers now consider completely and permanently gone as of 2026. GLAMOS estimates that roughly another 100 small Swiss glaciers disappeared between 2016 and 2023 — a pace this year’s melt appears to be extending rather than slowing.

    A record summer of meltwater is also a warning sign

    Between July and September 2026 alone, Swiss glaciers released an estimated 2.2 trillion liters of water — more than four times the amount all Swiss households drink in a year.

    Between July and September 2026, Swiss glaciers released roughly 2.2 trillion liters of meltwater — equivalent to more than four times the annual drinking-water consumption of every household in Switzerland.

    That sounds like abundance, and in the short term it was: the extra runoff topped up rivers during a hot, dry summer when demand for water was high. But glaciologists are blunt about what it really represents — a one-time withdrawal from a shrinking reserve, not a renewable supply. Glaciers act as a buffer that releases extra meltwater precisely in hot, dry years when it’s needed most; snowfall can replenish that mass over time, but only when accumulation exceeds losses, which has not been the case in most recent years. As the ice reserve keeps shrinking, its ability to smooth out future droughts shrinks with it.

    That matters beyond Switzerland too. Glacier melt contributes to summer runoff in Alpine river basins, including the Rhône and the Rhine, helping sustain flows during hot, dry periods for communities downstream in France, Germany, and beyond. The 2026 season offered unusually generous meltwater precisely because the ice had so much to give up. A smaller, thinner body of Alpine glaciers will have less stored ice to release in the next hot summer, and some smaller glaciers may disappear entirely.

    What the long record shows

    GLAMOS’s value lies partly in its length: continuous measurements stretching back decades let scientists tell a single rough year apart from a structural shift, and the longer-term record shows increasingly rapid losses, with the most recent ten-year period (2016–2026) substantially exceeding the losses seen in each earlier ten-year period. By the end of the 2025/2026 measurement season, Switzerland’s glaciers held an estimated 42.6 cubic kilometers of ice across 714 square kilometers of glacier-covered area — down by more than 30 cubic kilometers, and about a third in glacier-covered area, since 2000.

    Researchers caution against reading any single year, including 2026’s near-record losses, as proof of exactly what comes next; Alpine weather still varies year to year, and a cold, snowy winter can briefly slow the trend. But the multi-decade pattern GLAMOS has documented — each ten-year period worse than the last — is increasingly relevant to how water-resource managers, hydropower operators, and mountain communities across the Alps plan around the region’s future water supply.

    Sources: ETH Zurich, “Devastating year for Switzerland’s glaciers”, GLAMOS, Annual Report on Swiss Glaciers 2025/26, PBS NewsHour / Associated Press