Month: November 2026

  • [Science] Forest Lizards Gained About 2°C of Heat Tolerance in a Decade

    [Science] Forest Lizards Gained About 2°C of Heat Tolerance in a Decade

    Lizards living deep in Caribbean forests can now tolerate about 2°C more heat than their counterparts a decade ago, while species that can step into cooler spots barely changed. The contrast, reported by a Yale-led team in PNAS, suggests that an animal’s habitat and its ability to regulate body temperature through behavior may influence how quickly its heat tolerance changes in a warming world.

    原論文情報 / Original Paper
    Title: “Thermal ecology drives alternate responses to rising temperatures in Caribbean anoles”
    Authors: Saúl F. Domínguez-Guerrero et al.
    Journal: Proceedings of the National Academy of Sciences (2026)
    DOI: 10.1073/pnas.2537152123

    What the team found

    Researchers led by Saúl Domínguez-Guerrero and Martha Muñoz at Yale University compared how well 16 species of Caribbean anoles, small tree-dwelling lizards, handle extreme heat. The species live on three islands: Hispaniola, Jamaica and Puerto Rico.

    The team did not set out to catch evolution in action. They were studying how behavior shapes physiology, and they expected familiar results. Back in New Haven, though, the temperature data told an unexpected story, and a colleague’s offhand remark that something looked “weird” turned into the paper.

    The measure at the center of the study is the critical thermal maximum, or CTmax: roughly, the highest body temperature an animal can tolerate before reaching a defined point of impairment in an experiment. It is a measured threshold, not a prediction of the temperature that would kill the animal. Earlier teams had measured it for the same group of species on the same islands in 2011–2013. The Yale team repeated the work in 2022–2025, giving them a before-and-after comparison across roughly a decade.

    Not every species moved the same way

    The surprise was that the shifts were not uniform. Species in open or forest-edge habitats showed little change in heat tolerance. These lizards can move into shade or onto cooler perches, which helps keep their body temperatures in a suitable range. This strategy is known as behavioral thermoregulation.

    Species deep in closed forest canopy told a different story. With far fewer ways to escape the heat, their heat tolerance rose by about 2°C over the decade. According to the researchers, thermal ecology, meaning how an animal navigates the temperatures available in its environment, predicted these changes better than evolutionary relatedness or geographic closeness did.
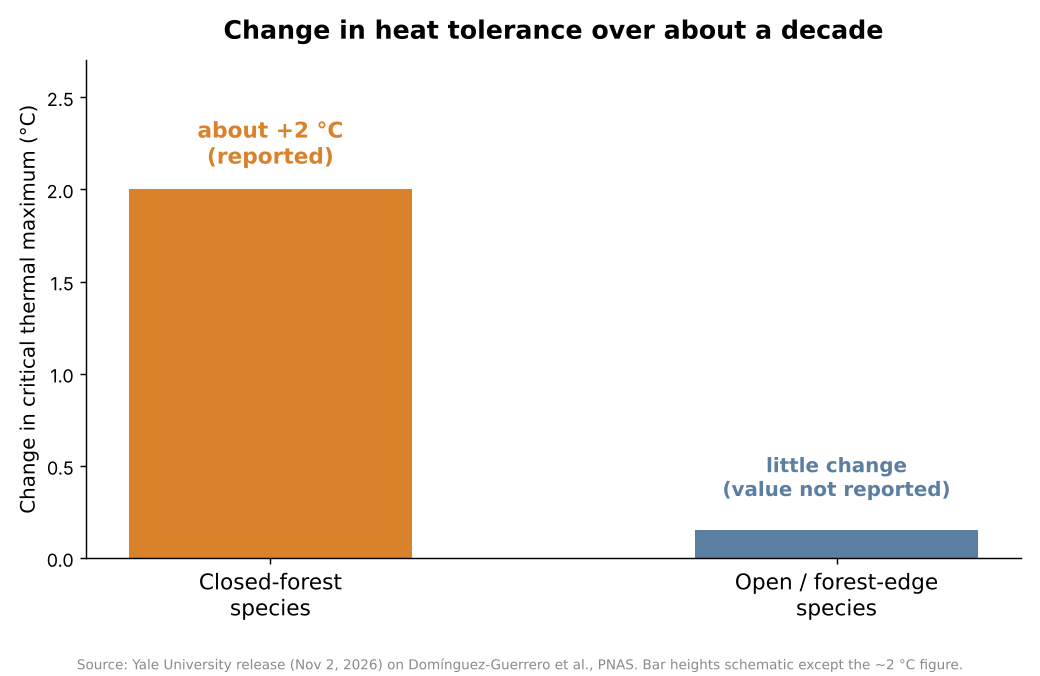
    Bar chart: closed-forest anoles gained about 2 degrees C of heat tolerance in a decade, open-habitat species changed little
    Figure 1. Reported change in heat tolerance over about a decade. Only the ~2 °C figure is a reported value; the other bar is schematic. Source: Yale University release on Domínguez-Guerrero et al., PNAS (2026).

    Why habitat matters

    An animal that can move into cooler surroundings may reduce its exposure to extreme heat, which lessens the pressure on its body to become more heat-tolerant. But when cooler places are scarce or hard to reach, the animal has fewer ways to avoid overheating, and stronger pressure for physiological change may follow. In the researchers’ words, behavior may help determine not only how animals respond to environmental change, but also how quickly they evolve.
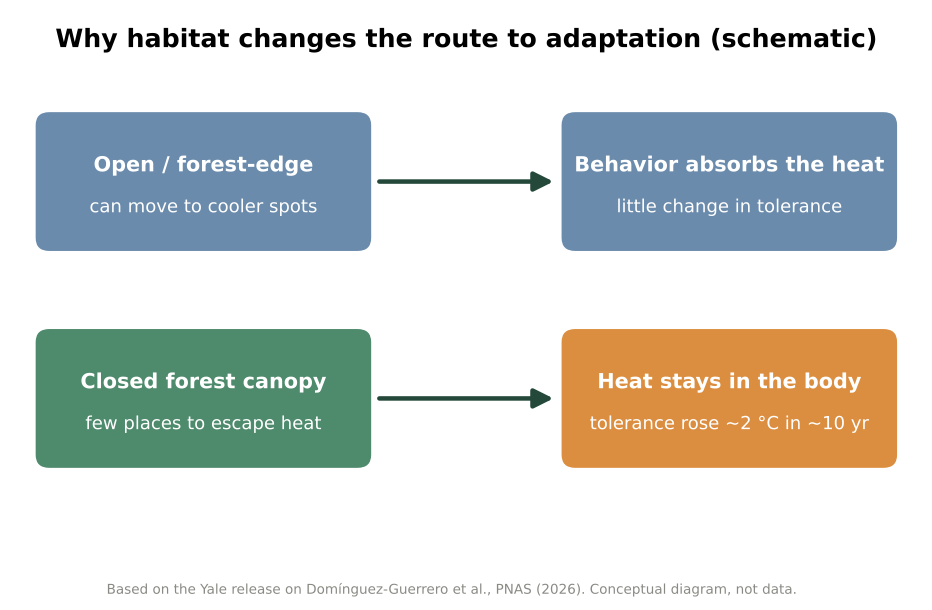
    Schematic: open habitats let lizards use behavior to avoid heat, closed forest leaves heat on the body and tolerance rose
    Figure 2. Conceptual diagram of the two routes (not measured data). Source: based on the Yale University release.

    Behavior as a buffer and a brake

    This logic echoes older work. In a 2003 paper in The American Naturalist, Raymond Huey and colleagues described how thermoregulatory behavior can reduce the selection pressure for changes in thermal physiology, an effect they called the Bogert effect. A 2014 PNAS study led by Jennifer Sunday, covering 296 species of cold-blooded animals, found that heat-tolerance limits are broadly similar across latitude and elevation, that tropical species lean more on behavior such as seeking shade, and that few species have much spare heat tolerance.

    Against that background, the Yale study adds a before-and-after comparison, over a decade, of closely related lizards that differ in their opportunities for behavioral thermoregulation.

    The team also tested lizard offspring to see whether the higher heat tolerance can be inherited. The Yale release does not detail the outcome, so readers who want the answer should consult the paper itself. In follow-up work mentioned by the researchers, similar patterns appear in lizard populations in Mexico, and frog tadpoles in temperature-stable ponds also seem to be gaining heat tolerance. Those observations were described only briefly.

    Not an escape hatch

    Lead author Domínguez-Guerrero cautions that both behavioral and physiological responses have limits. “These lizards may be racing to keep up,” he said, but they may eventually hit an “evolutionary ceiling,” a point beyond which their bodies can no longer adapt. The study did not establish where such a ceiling lies; the term is the researcher’s warning rather than a measured result.

    Rapid increases in heat tolerance in some species do not mean climate warming is harmless for reptiles. They show that different species respond in different ways, and that some may be better placed to cope than others.

    Xsciens Editorial Note

    Core point: lizards that cannot escape heat gained about 2°C of heat tolerance in ten years, while species with cooler hiding places changed little.

    • Observation versus interpretation. What was measured is the upper heat limit of 16 species at two points in time, 2011–2013 and 2022–2025. A before-and-after comparison alone cannot separate genetic evolution from flexible adjustment within an animal’s lifetime, so calling the change “adaptation” is the researchers’ interpretation. The roughly 2°C figure is for closed-forest species as a group, not every species.
    • Limits. The study compares two measurement periods rather than tracking the lizards continuously, and covers 16 species on three islands, so the pattern may not hold for all animals. We worked from the university release and news coverage because the full paper was not accessible to us, so details such as sample sizes per species were not available. The Mexico lizard and tadpole findings were mentioned only briefly.
    • What to watch next. How much of the change is heritable, whether other regions and animal groups show the same split, and how far heat tolerance can rise before physiological limits are reached. The 2014 survey of 296 species found few with much spare heat tolerance.
    • From the editors — a shady patch of forest may be worth as much to wildlife as any technological fix. If the pattern holds, planners could use it to spot species with few cool places to retreat to and protect the shade, dense vegetation and cool refuges around them first, though this study did not test such measures. The warning is built in: the researchers themselves expect an upper limit, so this is no reason to relax about warming. For the rest of us, even a tree, some shade and a water dish in a backyard count as habitat for the small animals nearby.

    References for this note: Huey, Hertz & Sinervo (2003), The American Naturalist, Sunday et al. (2014), PNAS

    Sources: Yale News, Phys.org, PNAS (Domínguez-Guerrero et al., 2026)
  • [Science] Mitochondrial DNA May Decide Whether Dying Cancer Cells Alert the Immune System

    [Science] Mitochondrial DNA May Decide Whether Dying Cancer Cells Alert the Immune System

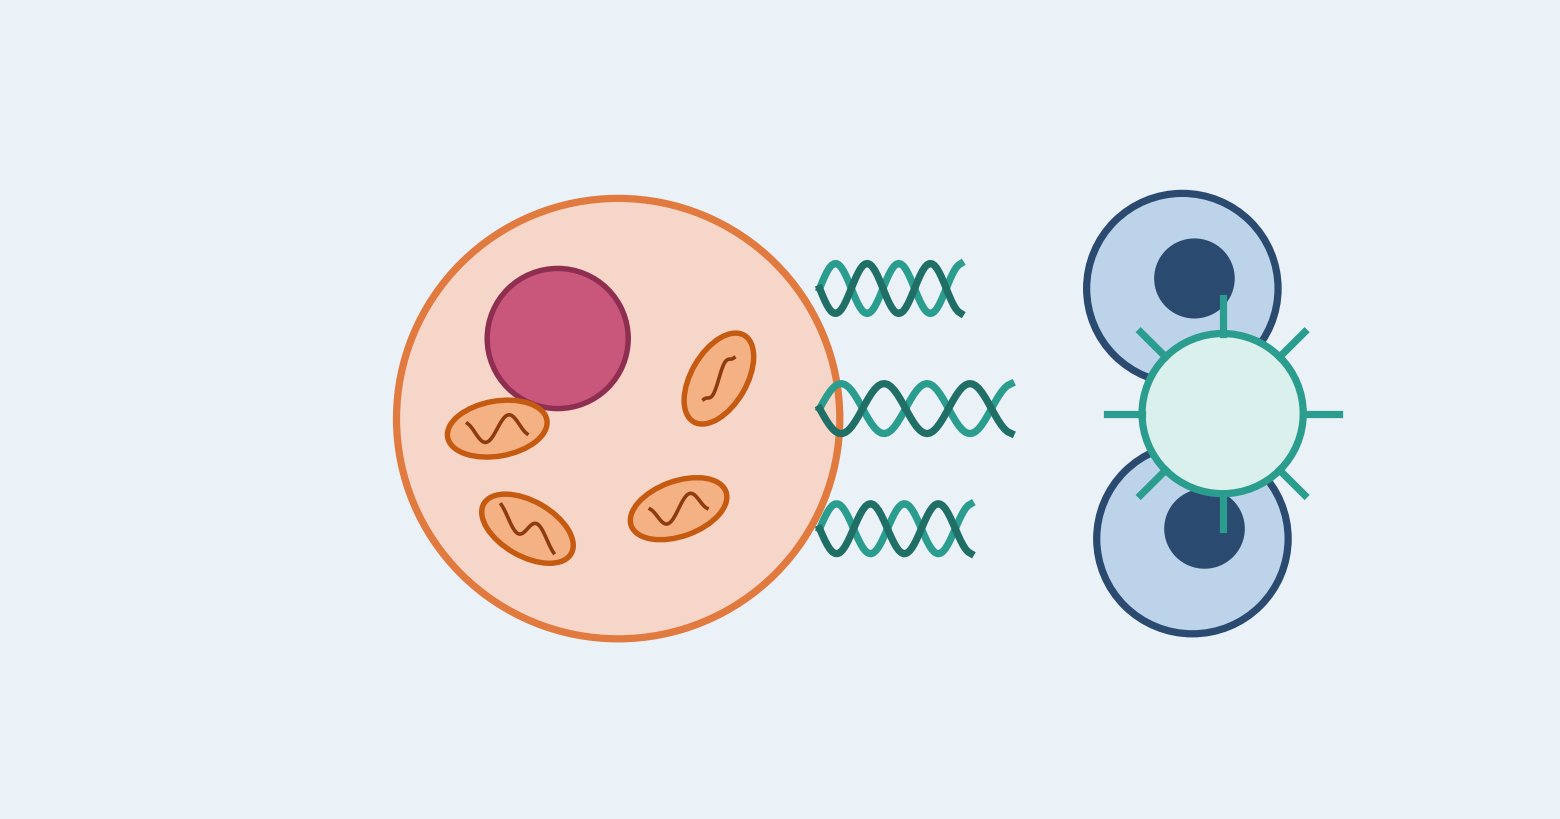
    Whether a dying cancer cell wakes up the immune system may depend on how much mitochondrial DNA it carries. A Japanese research team reports that cancer cells carrying KRAS mutations tend to accumulate mitochondrial DNA, and that a combination of drugs can make such cells die in a way that alerts the immune system. So far this has been shown only in cell experiments and mice, not in patients.

    原論文情報 / Original Paper
    Title: Mitochondrial DNA abundance is a determinant of immunogenic cell death in cancer
    Authors: Kosuke Tanaka, Yasuki Adachi, et al.
    Journal: Immunity (2026)
    DOI: 10.1016/j.immuni.2026.10.002

    Why the way a cancer cell dies matters

    Many cancer drugs work by killing tumor cells, but cells can die in different ways. In apoptosis, an orderly form of cell death, dead cells are generally cleared away without a strong immune response. Some deaths, however, alert the immune system. Researchers call this immunogenic cell death: the dying cells release signals that help immune cells recognize tumor material and go after surviving cancer cells. A widely cited 2020 consensus paper describes it as death that provides enough “antigenicity and adjuvanticity”, roughly, enough recognizable tumor antigens and enough additional signals to activate an immune response.

    This matters for treatment. Targeted drugs that block a specific faulty molecule in a tumor often work well at first, but cancers can resist them or relapse. Pairing them with immune checkpoint inhibitors, drugs that release the brakes on immune cells, is an attractive idea. Whether the pairing works may depend on whether the targeted drug makes cancer cells die in a way the immune system can see, and what decides that has been poorly understood. The researchers therefore asked whether something inside the cancer cell itself could tip the balance. Their attention turned to mitochondria, the structures that produce energy for the cell.

    KRAS-mutant cancers hoard mitochondrial DNA

    Mitochondria carry a small loop of their own DNA, called mtDNA. When mtDNA leaks into the main body of the cell, a protein called cGAS detects it and activates another protein, STING. This cGAS-STING pathway triggers the production of type I interferons, immune signaling proteins that help alert the body’s defenses.

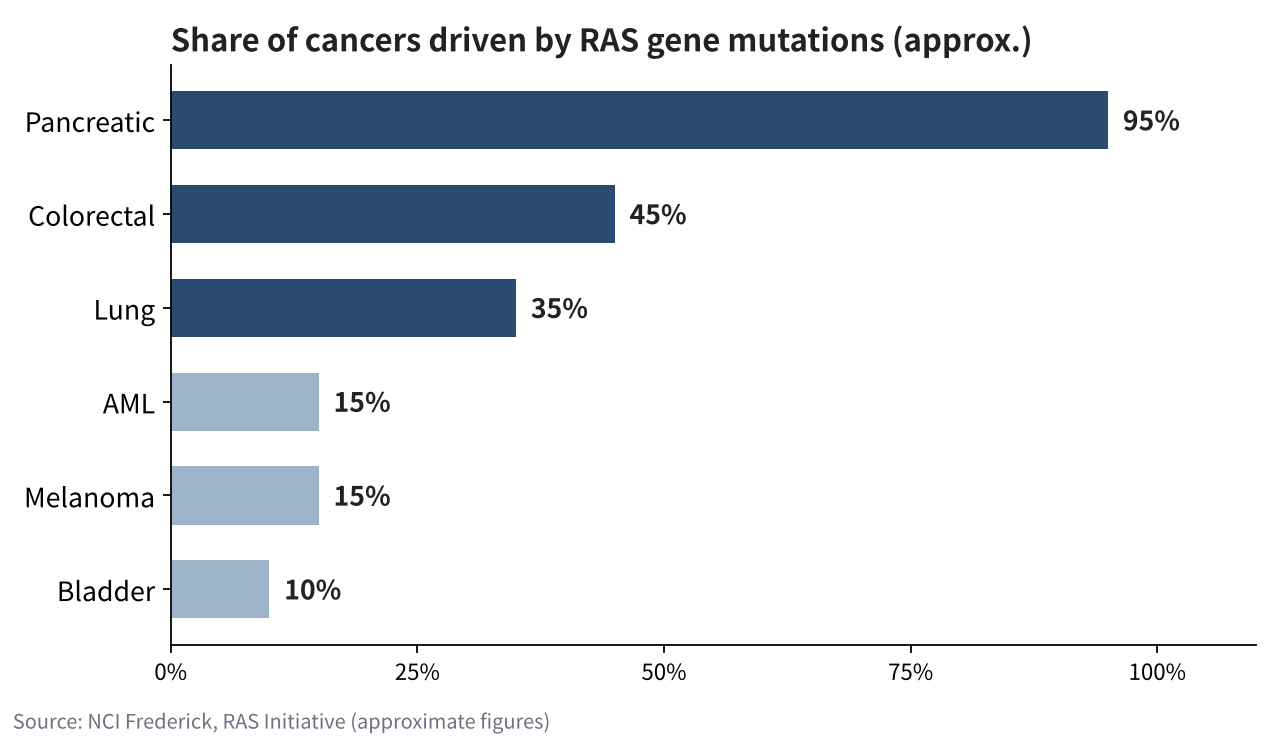
    The team first mined public databases of cancer cell lines. Whether a line carried a KRAS mutation tracked its mtDNA level more closely than the type of cancer did, and lung, colorectal, pancreatic and biliary cancers with KRAS mutations tended to hold more mtDNA. According to the researchers, KRAS mutations increase reactive oxygen species (ROS), chemically reactive molecules that can damage cell components, and these also promote the copying of mtDNA. Such cancers are common: the U.S. National Cancer Institute’s RAS Initiative estimates that mutations in the RAS gene family, which includes KRAS, are found in roughly a third of human cancers, including about 95 percent of pancreatic cancers, 45 percent of colorectal cancers and 35 percent of lung cancers.

    Bar chart of approximate shares of cancers with RAS gene mutations: pancreatic 95%, colorectal 45%, lung 35%, AML 15%, melanoma 15%, bladder 10%
    Source: NCI Frederick, RAS Initiative (approximate figures). RAS is the gene family that includes KRAS.

    Letting the DNA out, then removing the brake

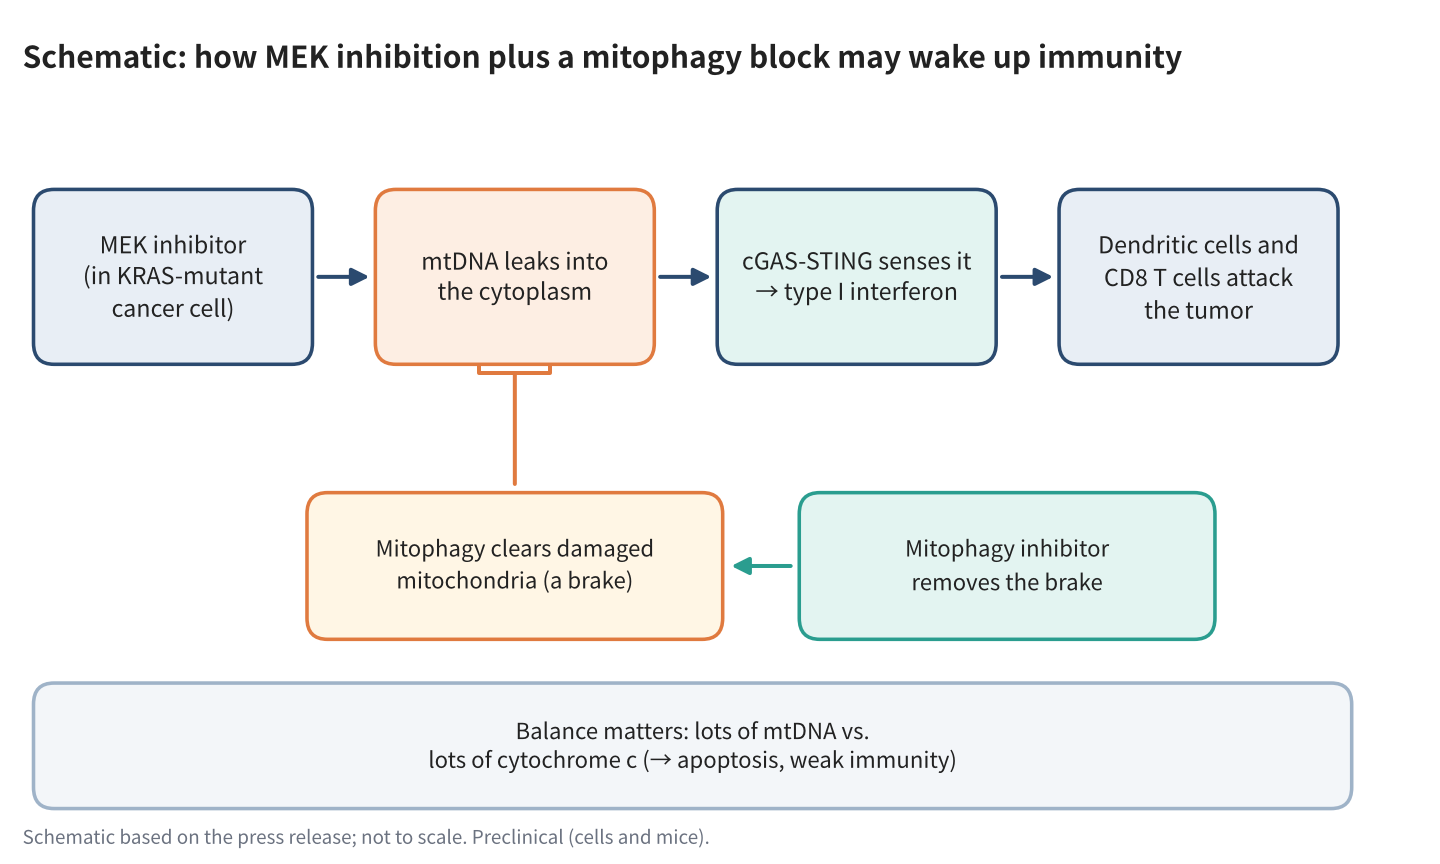
    In KRAS-mutant cells, a drug that blocks MEK, a protein in the same growth-signaling chain as KRAS, made mtDNA escape into the cytoplasm. But the drug also switched on mitophagy, the cell’s routine for clearing out damaged mitochondria, which limited the leak. The team found that this cleanup involved a protein called PRKN, which helps remove damaged mitochondria and thereby holds back the release of mtDNA.

    The two drugs thus work in opposite ways: one causes mitochondrial damage and releases mtDNA, while the other stops the cell from cleaning up. When the researchers added chloroquine, which they used experimentally to inhibit mitophagy, damaged mitochondria were no longer cleared as effectively, mtDNA kept escaping, and the type I interferon response grew stronger. The response did not appear in cells with little mtDNA or in cells lacking STING. Across human cancers, the team also noted that higher PRKN expression went along with less immune-cell infiltration.

    Schematic of MEK inhibition plus a mitophagy block causing mtDNA leakage, cGAS-STING signaling and an immune attack on the tumor
    Schematic based on the press release; not to scale. Preclinical (cells and mice).

    A balance with cytochrome c

    There was a second ingredient. Cytochrome c is a protein normally involved in energy production inside mitochondria; when released into the cell, it helps trigger the machinery of apoptosis. The researchers found that the relative amounts of mtDNA and cytochrome c help determine whether drug-treated cells undergo apoptosis or immunogenic cell death.

    In lung cancer cells with a lot of mtDNA, such as those with KRAS mutations or ALK or ROS1 gene fusions, the drug combination produced an immune response. In EGFR-mutant lung cancer cells, which carry a lot of cytochrome c, cells mainly died by apoptosis, and lowering cytochrome c shifted them toward immunogenic death. Pushing the drugs too hard also favored apoptosis and weakened the immune response, a hint that simply killing more cancer cells is not always the better goal.

    What happened in mice

    In a mouse model of KRAS-mutant colorectal cancer, the team combined a MEK inhibitor, a mitophagy inhibitor and an anti-PD-1 antibody, a type of checkpoint inhibitor. The three-drug combination suppressed tumor growth, and tumors disappeared in 2 of 12 mice. The effect depended on dendritic cells, which show tumor fragments to other immune cells, and on CD8-positive T cells, the immune system’s cancer-killing cells. Tumors with low mtDNA did not respond. These results show an effect in a preclinical model; whether the same strategy can work in patients remains unknown.

    The findings suggest that successful cancer treatment may depend not only on how many cancer cells are killed, but also on how their deaths affect the immune system. According to the press release, the team’s next steps are to test whether mtDNA abundance can predict how patients respond to treatment and to develop strategies that combine targeted drugs with immunotherapy. The work was supported in part by Japan’s AMED and the Moonshot R&D Program.

    Xsciens Editorial Note

    The study suggests that how much mitochondrial DNA a tumor carries helps decide whether drug-induced cell death rouses the immune system.

    • Observation versus model. What was observed: KRAS mutation tracked mtDNA levels in public cell-line data, and the drug combination caused mtDNA leakage and interferon signaling in cells. The mtDNA-versus-cytochrome c “balance” is the team’s explanation, built from experiments in which those molecules were manipulated in cells. The 2-of-12 figure counts complete tumor disappearance in mice, not an overall response rate.
    • Limits. The evidence comes from cell experiments, analyses of public cancer databases and mouse models. Although the researchers looked at patterns in human cancers, they have not shown that the drug combination works in patients. Chloroquine was an experimental tool to inhibit mitophagy, not a validated cancer treatment, and nothing here supports anyone taking it for cancer.
    • What to watch. Whether mtDNA abundance can predict treatment response in patients, and whether it must be read alongside cytochrome c levels and other features of the tumor environment. The team says this still needs testing.
    • From the editors — if this holds up, cancer care could get smarter about how tumors die, not just whether they do. Doctors might one day check a tumor’s mitochondrial DNA to pick drugs that leave the immune system alert to any survivors, which could mean fewer relapses. But all of this rests on cells and mice so far, and pushing a tumor too hard can backfire, as this very study shows. If you or someone close is in treatment, keep an eye on this field, but treat no single drug as the answer.

    References for this note: Galluzzi et al., Consensus guidelines for the definition, detection and interpretation of immunogenic cell death (J Immunother Cancer, 2020), NCI Frederick, RAS Initiative, Lin et al., Editorial: Mitochondrial damage interacts with the immune system and tumor microenvironment (Front Immunol, 2025)

    Sources: Immunity (Tanaka et al., 2026), Nagoya University / National Cancer Center Japan / Kyoto University press release (Nov 2, 2026, in Japanese), Kyoto University research news (in Japanese)

  • [Science] Possible New Dwarf Planet Beyond Pluto Found in Rubin Observatory Data

    [Science] Possible New Dwarf Planet Beyond Pluto Found in Rubin Observatory Data

    Astronomers using data from the Vera C. Rubin Observatory have identified an object called 2026 ED138, currently about 46 times farther from the Sun than Earth is and perhaps 600 to 1,500 kilometers across — large enough that it may qualify as the solar system’s sixth dwarf planet. It matters because it shows that sizable worlds can still hide in the outer solar system, and that new survey data and search software are now able to dig them out.

    原論文情報 / Original Paper
    Announcement: Possible new dwarf planet 2026 ED138 (provisional designation)
    Announced by: NSF–DOE Vera C. Rubin Observatory / NOIRLab, October 27, 2026
    Discoverer: Matthew Holman, Center for Astrophysics | Harvard & Smithsonian
    Peer-reviewed paper: none cited in the coverage we checked. Source: University of Washington News

    What the team found

    The object carries the provisional name 2026 ED138. It was first identified on the evening of October 13, 2026, by astronomer Matthew Holman of the Center for Astrophysics | Harvard & Smithsonian, who was sifting through images that the NSF–DOE Vera C. Rubin Observatory had collected earlier this year; the University of Washington describes that data as preliminary. The object had been photographed before, but never recognized as a single moving body. Holman developed the search code together with colleague Kevin Napier. It links billions of detections of moving objects to work out which ones belong to the same body. Holman has described his first reaction as “excited disbelief,” and he immediately checked whether he or the code had made a mistake.

    Once the candidate was in hand, more data fell into place. According to Space.com and Universe Today, Rubin’s telescope recorded it 30 times on 20 nights between March 4 and July 11, 2026. Mario Jurić of the University of Washington, who leads Rubin’s solar system team, turned up additional detections in the catalog. Archival images from other surveys, including the Dark Energy Camera on a 4-meter telescope in Chile, extend the record back to 2016. That gives the team more than a decade of positions from which to calculate the orbit.

    Where it was hiding

    ED138 is currently about 46 astronomical units from the Sun (one astronomical unit is the Earth–Sun distance), compared with about 40 for Pluto on average. Its orbit is tilted roughly 25 degrees from the plane in which the planets travel, a tilt Space.com says likely stems from a gravitational interaction with Neptune. Universe Today describes it as a “hot classical” object, a label for icy Kuiper belt bodies on more tilted, disturbed orbits.

    The location also helps explain why it was missed. ED138 lies in a region near the plane of our own galaxy, where the Milky Way’s dense star field makes faint, slowly moving dots hard to pick out. The University of Washington’s write-up says this likely hid it from most other telescopes. Finding it took both Rubin’s repeated imaging and software built to link scattered faint detections. We covered a similar story of patient, data-driven discovery in our earlier piece on a possible hidden pair of supermassive black holes.

    How big is it, really?

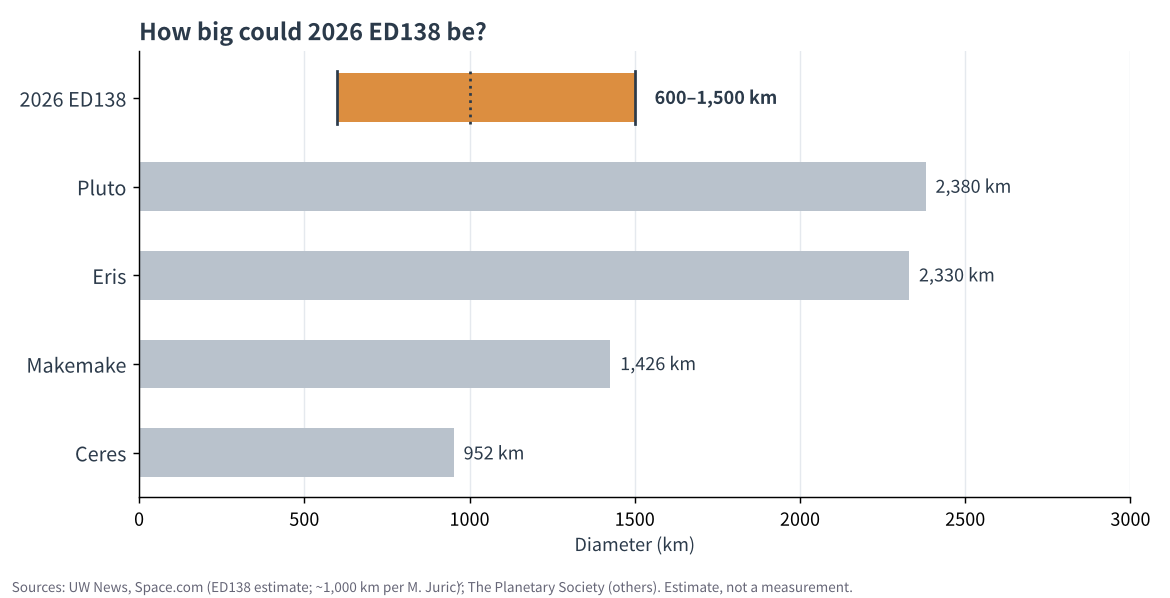
    The headline estimate is 600 to 1,500 kilometers across. That would put ED138 anywhere from a modest icy world, smaller than Ceres, up to one comparable to the dwarf planet Makemake, which is about 1,430 km wide according to The Planetary Society. Jurić has put the best guess near 1,000 km and, as Gizmodo reports, called it the largest trans-Neptunian object found in about 20 years. Those figures remain estimates.

    Bar chart comparing the estimated 600 to 1,500 km size of 2026 ED138 with Ceres, Makemake, Eris and Pluto
    Estimated size of 2026 ED138 compared with known dwarf planets. Sources: UW News, Space.com, Gizmodo (ED138 estimate); The Planetary Society (others).

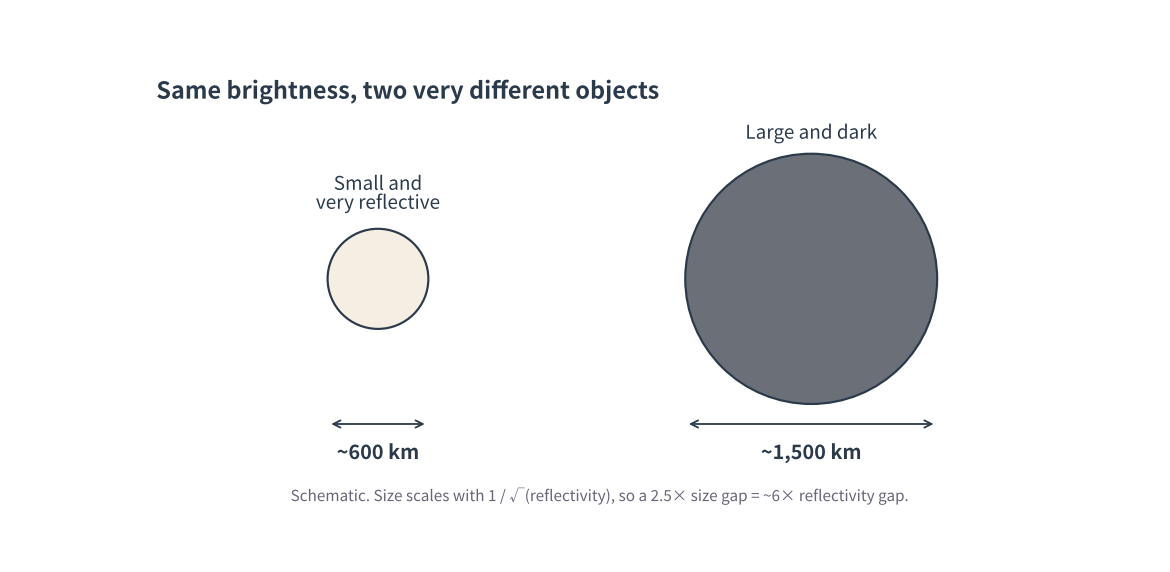
    Why such a wide range? Telescopes see reflected sunlight, and how much light arrives depends on two things at once: how big the object is and how reflective its surface is (its albedo). A small, shiny body and a large, dark body can look equally bright from far away. The team estimated size from distance, brightness and an assumed surface reflectivity, so the range mostly reflects uncertainty about that reflectivity. A 2.5-fold gap in diameter corresponds to roughly a six-fold gap in albedo.

    Schematic of a small reflective body and a large dark body appearing equally bright
    Schematic: the same brightness can come from a small, reflective object or a large, dark one. Created by Xsciens.

    What counts as a dwarf planet

    NASA summarizes the International Astronomical Union’s definition: a dwarf planet orbits the Sun, is massive enough for its own gravity to pull it into a nearly round shape, has not cleared the neighborhood around its orbit, and is not a moon. Five objects are recognized today: Ceres, Pluto, Eris, Haumea and Makemake. If ED138 is confirmed to meet the criteria and is formally recognized, it would be the sixth.

    Roundness is why size matters so much. The University of Washington’s write-up notes that icy bodies of this scale are expected to be round, but nobody has yet observed ED138 well enough to see its shape. Until its diameter and shape are measured, “candidate” is the accurate word.

    What happens next

    Follow-up work will aim to pin down the size. Space.com reports that this requires infrared observations, naming the James Webb Space Telescope, because an object’s heat emission helps separate its size from its reflectivity. Meanwhile, Rubin’s ten-year survey of the southern sky, which began in June 2026, continues, and searches of older images — “precovery,” in Jurić’s term, meaning finding an object in images taken before anyone recognized it — may turn up more objects earlier surveys missed.

    In the coverage we checked, no peer-reviewed paper accompanies the announcement, so the numbers above should be read as the team’s preliminary estimates.

    Xsciens Editorial Note

    This is a candidate, not a confirmed dwarf planet: its orbit is calculated from about a decade of positions, but its size is still an estimate.

    • Observed versus calculated. What astronomers recorded directly were positions and brightness in many images. The distance (about 46 au) and the orbital tilt (about 25°) are calculated from them, and the 600–1,500 km diameter is a further estimate that also assumes how reflective the surface is, which is why the range spans a factor of 2.5.
    • Limits. Roundness has not been observed, and the coverage we reviewed cites no peer-reviewed paper. This note rests on the announcement and secondary coverage; we could not open the NOIRLab release itself. “Hot classical” is Universe Today’s description, for a category of Kuiper belt objects defined by widely tilted orbits.
    • What to watch. Infrared measurements of its size, for which Space.com points to the James Webb Space Telescope, and whether the object is formally recognized as a dwarf planet.
    • From the editors — the solar-system poster on a classroom wall may soon need a new line. If Rubin keeps scanning the southern sky for ten years, more faint worlds could plausibly turn up, ones that hid in crowded star fields or slipped between older surveys. The catch is that “candidate” is the operative word, and until the size is measured the headline number could move a lot. So treat 1,000 km as a placeholder, and look again when the infrared measurements arrive.

    References for this note: NASA, What is a planet?, Müller et al., Trans-Neptunian objects and Centaurs at thermal wavelengths (arXiv), Petit et al., Canada-France Ecliptic Plane Survey (arXiv)

    Sources: University of Washington News, Space.com, Universe Today, Gizmodo, The Planetary Society

  • [Science] Why Is Japan So Strong in Materials? The Industry Structure and Three Hypotheses, Read Through Cases

    [Science] Why Is Japan So Strong in Materials? The Industry Structure and Three Hypotheses, Read Through Cases

    The chips in a smartphone, the airframe of a jet and the battery in an electric car all get their performance from materials. In materials, Japanese companies hold a majority of world share in a number of fields. This article checks the current picture and the challenges against official documents, lays out the industry structure materials sit in, and then digs into why Japan is strong through three hypotheses and company cases.

    Key data in this article
    • METI, New Materials Industry Vision (interim summary, June 2022): Materials are 20% of manufacturing GDP; Japanese firms hold 70% of photoresist, and one firm (Company A) 80% of rolled copper foil for FPCs
    • METI, Global Niche Top Companies 100 (2020 edition): 113 selected firms: average world share 43.4%, average operating margin 12.7% (manufacturing average 4.8%)
    • Cabinet Office, Materials Innovation Strategy (June 2025): Many materials above 60% world share; names “suriawase-type development” as a Japanese strength

    Where things stand: strength in share and margins

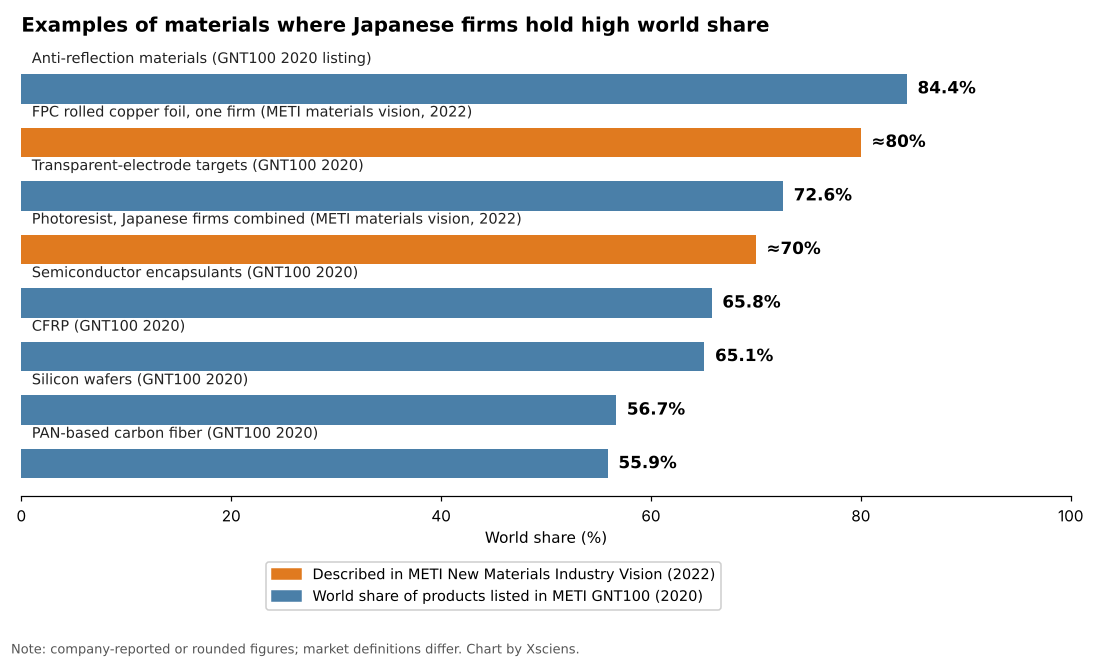
    According to the interim summary of METI’s New Materials Industry Vision (June 2022), materials account for 20% of Japan’s manufacturing GDP and support 220,000 jobs in steel and 940,000 in chemicals. Japanese firms hold 70% of the world market for photoresist, the chemical used to print circuits onto chips, and one company, Company A, holds 80% of rolled copper foil for flexible printed circuits (FPCs), the bendable wiring in smartphones. The Cabinet Office’s Materials Innovation Strategy (June 2025), citing a NEDO survey, also notes many materials with world share above 60%.

    The strength shows in profits as well as share. METI’s 2020 Global Niche Top Companies 100 selected 113 firms from 249 applicants. Their average world share was 43.4% and their average operating margin 12.7%, well above the 4.8% manufacturing average (fiscal 2018). In materials and chemicals alone, the margin was 13.9% and the average share 50.6%.

    Bar chart of materials and components where Japanese firms hold high world shares, ranked by share
    Source: Chart by Xsciens based on METI, New Materials Industry Vision interim summary (2022) and METI GNT100 (2020). Orange bars are figures described in the METI vision; blue bars are products listed in GNT100. Some values are company-reported or rounded and market definitions differ, so bars are not strictly comparable.

    There are challenges too. The same METI document shows China’s share of world crude steel output rising from 15% in 2000 to 53% in 2020. The Cabinet Office’s 2025 strategy lists stagnant paper counts, a declining international presence, a shortage of people who can run data-driven materials development (materials informatics, MI), and slow social implementation. NISTEP reports that, on a fractional-count basis, Japan’s Top10% and Top1% adjusted paper counts in chemistry, materials science and basic life sciences fell by 20% or more between 2010 and 2020. PwC Japan’s analysis points to the small scale of high-share businesses, low overseas sales ratios and a “valley of death” between research and commercialization.

    What industry structure do materials sit in?

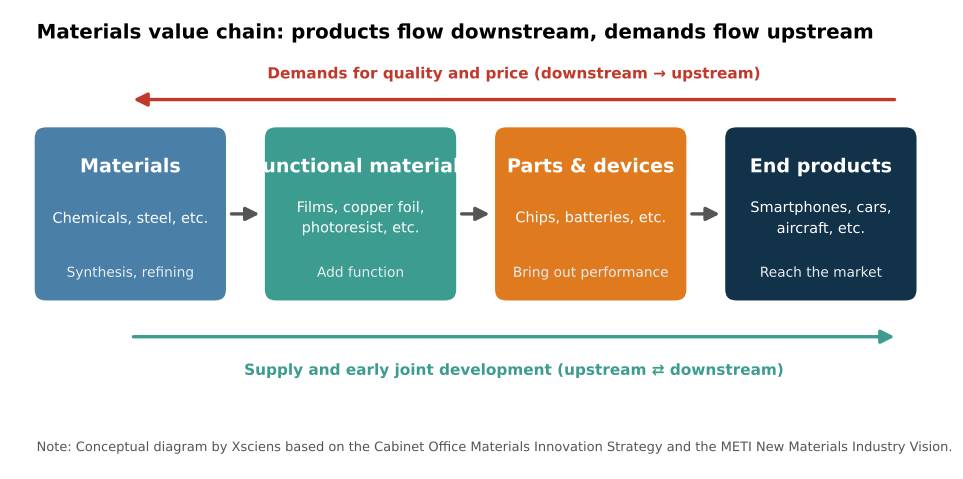
    Materials are inconspicuous in the final product. The Cabinet Office strategy describes materials as both “constituents of end products and the source of their functions.” Material makers produce functional materials such as films, copper foil and photoresist; parts makers use them in chips and batteries; and finally smartphones, cars and aircraft are completed. Along this chain, material makers face demanding quality and price requirements from downstream industries. METI describes meeting them as the foundation of other industries’ competitiveness.

    Diagram of the value chain from materials to functional materials, parts and devices, and end products, with quality and price demands flowing upstream and early joint development linking both ends
    Source: Conceptual diagram by Xsciens based on the Cabinet Office Materials Innovation Strategy and the METI New Materials Industry Vision.

    Sitting there, materials have an impact far beyond their cost. For Ajinomoto’s ABF, an insulating film used in semiconductor packages, a GIGAZINE article of April 2026 reports that it makes up less than 0.1% of the product price, yet its share is close to 100%, and surging demand for AI chips could create shortages. The Cabinet Office strategy likewise says Japan has many items with very high world share that hold an indispensable place in global supply chains.

    Why the hypotheses matter

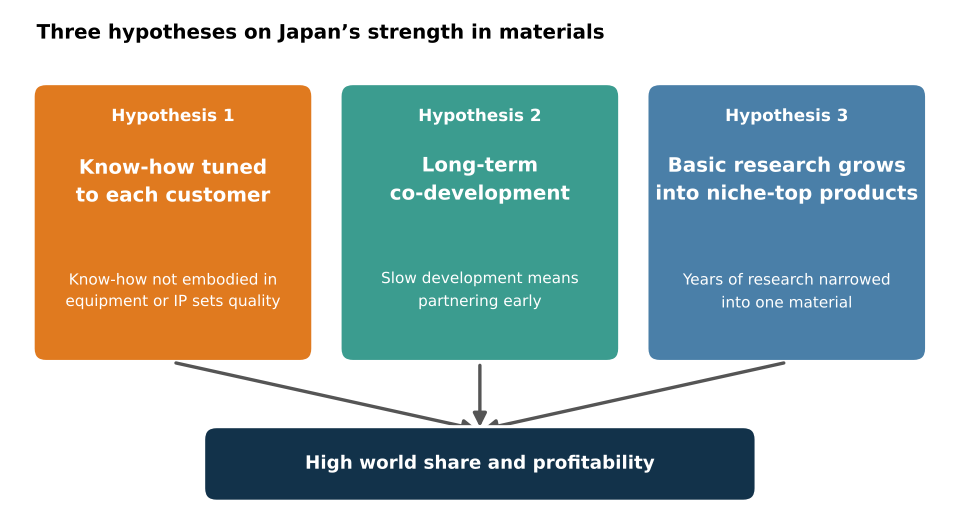
    Strength in materials does not stay in visible form like equipment or patents. Unless we ask why Japan is strong, we cannot see what to protect or what to build on next. The Cabinet Office strategy names “suriawase-type development” (close tuning with the user), the know-how of evaluation, analysis, processing and synthesis, and strong industry-academia ties as Japanese strengths, and stresses long-term investment because materials R&D takes a long time. From this we organize the reasons into three hypotheses.

    Concept diagram: know-how tuned to each customer, long-term co-development, and basic research growing into niche-top products lead to high world share and profitability
    Source: Concept diagram by Xsciens based on the cited documents.

    Hypothesis 1 is shop-floor “suriawase”: polishing a product to each customer. Hypothesis 2 is long-term co-development: partnering early with downstream customers and growing a product over years. Hypothesis 3 is that years of basic research grow into niche-top products focused on one material. Below, we look at why each matters and how it works in practice, using a different company for each.

    Hypothesis 1: shop-floor “suriawase” tuned to each customer

    The best conditions for a material differ with each buyer’s process. METI’s document says that “know-how not embodied in equipment or intellectual property is the source of the materials industry’s strength.” Equipment and patents can be bought or studied, but know-how built up in people and organizations is hard to copy from outside. The Cabinet Office strategy also calls evaluation, analysis, processing and synthesis techniques “a mass of know-how.” That is why hypothesis 1 matters: it is a source of resistance to imitation.

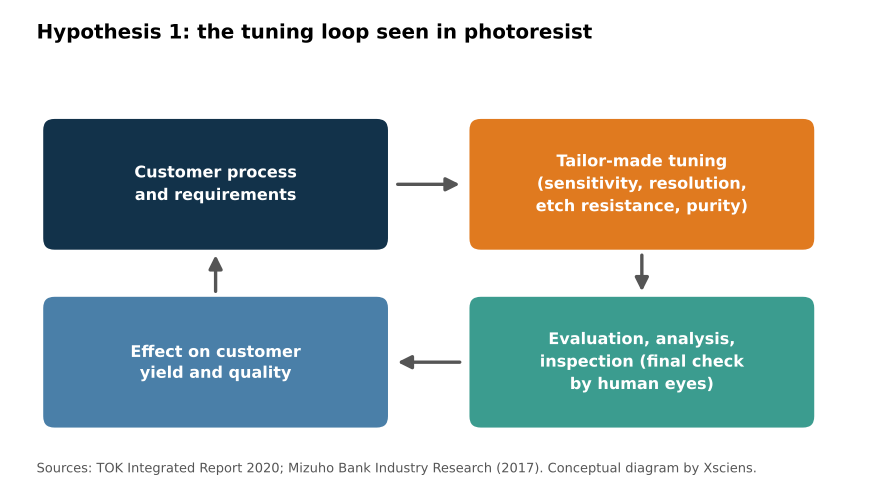
    In practice, take TOK (Tokyo Ohka Kogyo), a photoresist maker. Its 2020 integrated report describes its strength as the ability to quickly deliver tailor-made photoresists, fine-tuned to each customer’s needs and each process’s requirements. The performance factors include sensitivity, resolution, etch resistance and purity, and the report says photoresist greatly affects a customer’s quality and yield. TOK is ranked first in the world for semiconductor photoresist, with a 25.6% share by projected 2020 shipment volume.

    Loop showing customer process and requirements, tailor-made tuning, evaluation, analysis and inspection, and the effect on customer yield and quality
    Source: Conceptual diagram by Xsciens based on TOK Integrated Report 2020 and the Mizuho Bank Industry Research report (2017).

    A 2017 report by Mizuho Bank’s Industry Research Division names two common strengths of Japanese material makers, the ability to develop products to customer needs and efficient, stable production operations, and says they have prized inspection steps where “in the end, people check by eye” to meet demanding domestic customers. Receive the customer’s requirement, tune, inspect, return. Repeating this loop for years builds up as shop-floor know-how.

    Hypothesis 2: long-term co-development with downstream customers

    Materials R&D takes a long time. The Cabinet Office strategy therefore calls for research and development in which upstream and downstream industries cooperate from the early stages. Partnering with customers early and growing uses together makes a material a lasting part of the customer’s product. That is why hypothesis 2 matters.

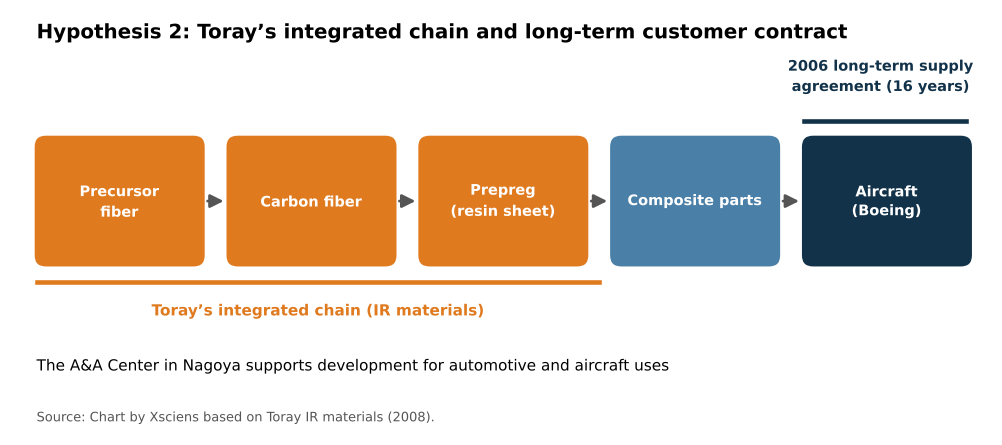
    The practice shows in Toray’s carbon fiber. According to Toray’s investor materials, the company signed a 16-year long-term carbon-fiber composite supply agreement with Boeing in 2006. An ITmedia article (February 2009) reports that this was an exclusive contract under which Boeing buys the 787’s structural carbon fiber from Toray alone, and that Toray kept developing carbon fiber for about 40 years while accepting losses, selling it for golf clubs and the like while pursuing aircraft certification. Its model is integrated production from precursor fiber through carbon fiber to prepreg (resin-impregnated sheet). In Nagoya it set up the A&A Center, a technology development site that includes the AMC for automotive uses (opened June 2008) and the ACC for composite product development (scheduled to open April 2009). In the same document Toray projected a world carbon-fiber share of about 37% after its capacity expansion (a 2008 plan).

    Flow from precursor fiber to carbon fiber, prepreg, composite parts and aircraft (Boeing), with the 2006 long-term supply agreement
    Source: Chart by Xsciens based on Toray IR materials (2008).

    Looking from material to composite to the customer’s airframe, and promising supply under a 16-year contract: the length of this relationship becomes the base for growing uses together with the customer.

    Hypothesis 3: basic research grows into niche-top products

    Materials research takes years to become a product. The Cabinet Office strategy calls Japan’s materials field one with relatively strong industry-academia ties and, on the principle that “industry is the dojo of scholarship,” seeks to advance social implementation and deeper science together. A path that grows accumulated basic research into products focused on one material is why hypothesis 3 matters.

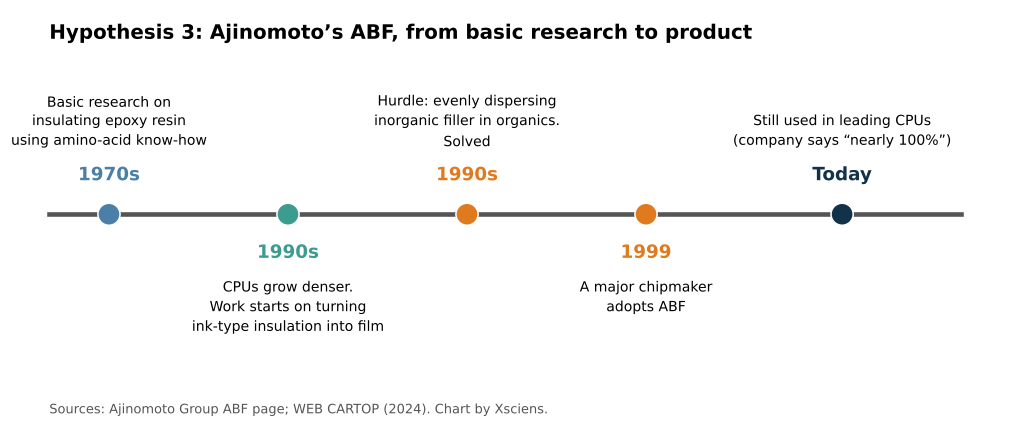
    The practice shows in Ajinomoto’s ABF. According to the Ajinomoto Group, in the 1970s it continued basic research on insulating epoxy resin using its amino-acid know-how. In the 1990s, as CPUs grew denser and pin counts rose from an early 40 to over a thousand, a new insulating material for circuit boards was needed. As a latecomer, Ajinomoto took on the task of turning an ink-type insulating material into a film. The hurdle was mixing organic matter (epoxy resin and hardener) with inorganic filler and dispersing it evenly, which the research team solved to make a thermosetting film. A major chipmaker adopted it in 1999, and it is still used in leading CPUs. The company offers customers the processing method as a system, including optimized laser drilling and copper plating.

    Timeline of Ajinomoto’s ABF from 1970s basic research through 1990s filming, 1999 adoption, and today
    Source: Chart by Xsciens based on the Ajinomoto Group ABF page and WEB CARTOP (2024).

    WEB CARTOP (June 2024) also reports that ABF’s history begins with amino-acid R&D in the 1970s. It is a case where basic research that began in the 1970s met a market need in the 1990s and became a product. The same flow shows in Akira Yoshino, who shared the 2019 Nobel Prize in Chemistry. According to the Nobel Foundation, the prize was shared with Whittingham and Goodenough “for the development of lithium-ion batteries,” and Yoshino’s affiliations were Asahi Kasei and Meijo University. Corporate and university research came together in a battery product.

    Outlook: keeping the edge

    According to METI, materials industries such as steel and chemicals account for about 80% of industrial CO₂ emissions, so in a decarbonizing world, materials that cut emissions are themselves a competitive asset. The way materials are developed is also changing. METI cites a catalyst developed with Yokohama Rubber in which MI achieved a world-best yield (60–70%) and a catalyst matching the performance of crude-oil-derived tires. The Cabinet Office notes that DeepMind predicted about 2.2 million stable compounds. Turn hypothesis 1’s shop-floor know-how into data, extend hypothesis 2’s customer ties to new uses, and sustain hypothesis 3’s basic research. Whether Japan can overlay all three is the key to the next decade. For an example of basic materials chemistry, see our article Ammonia From Air Under Milder Conditions: Kyoto University and Others Explain Why a Molybdenum Catalyst Works.

    Xsciens Editorial Note

    Japan’s strength in materials is easier to understand as accumulated strength in which three hypotheses overlap, rather than a single cause.

    • Read share figures with definitions and dates aligned. For photoresist, Japanese firms combined are 70% in METI’s document, about 90% in PwC Japan’s analysis, and TOK alone is 25.6% (projected 2020 shipments), so figures differ by source. The GNT100 figures include company-reported values. When comparing, check the source, year and market scope.
    • The three hypotheses are not proof of causation. They are leading views drawn from documents and cases, and we found no study that separates how much each one contributes. TOK, Toray and Ajinomoto are all success stories, and the same path may not apply to every material.
    • The base of the strength is past accumulation, with no guarantee for the future. Ajinomoto’s ABF is a case where basic research that began in the 1970s became a product in the 1990s. If highly cited papers are now declining and materials-development talent is short, the effect may show in a few years.
    • From the editors — the smartphone and battery you use every day are made of layers of materials whose names you may never have heard. Knowing that Japanese firms support a number of them may change how you read the next “new material” headline. Still, strength does not last by itself. Take pride in today’s numbers, and keep an eye on whether investment in research and people continues.

    References for this note: PwC Japan analysis of the chemicals industry (scale of high-share businesses, valley of death), Mizuho Bank Industry Research, “Materials” (2017), ITmedia Business Online (February 2009), WEB CARTOP (June 2024), NISTEP RM329 press release (international paper comparison)

    Sources: METI, New Materials Industry Vision interim summary (2022), Cabinet Office, Materials Innovation Strategy (2025), METI GNT100 2020, TOK Integrated Report 2020, Toray IR materials, ITmedia Business Online (February 2009), Ajinomoto Group ABF, GIGAZINE (April 2026), Nobel Foundation (2019 Chemistry), PwC Japan, NISTEP RM329